If you have not used Cloudflare Logs before, refer to the Logs documentation for more details. Contact your Cloudflare Customer Account Team to enable logs for your account.
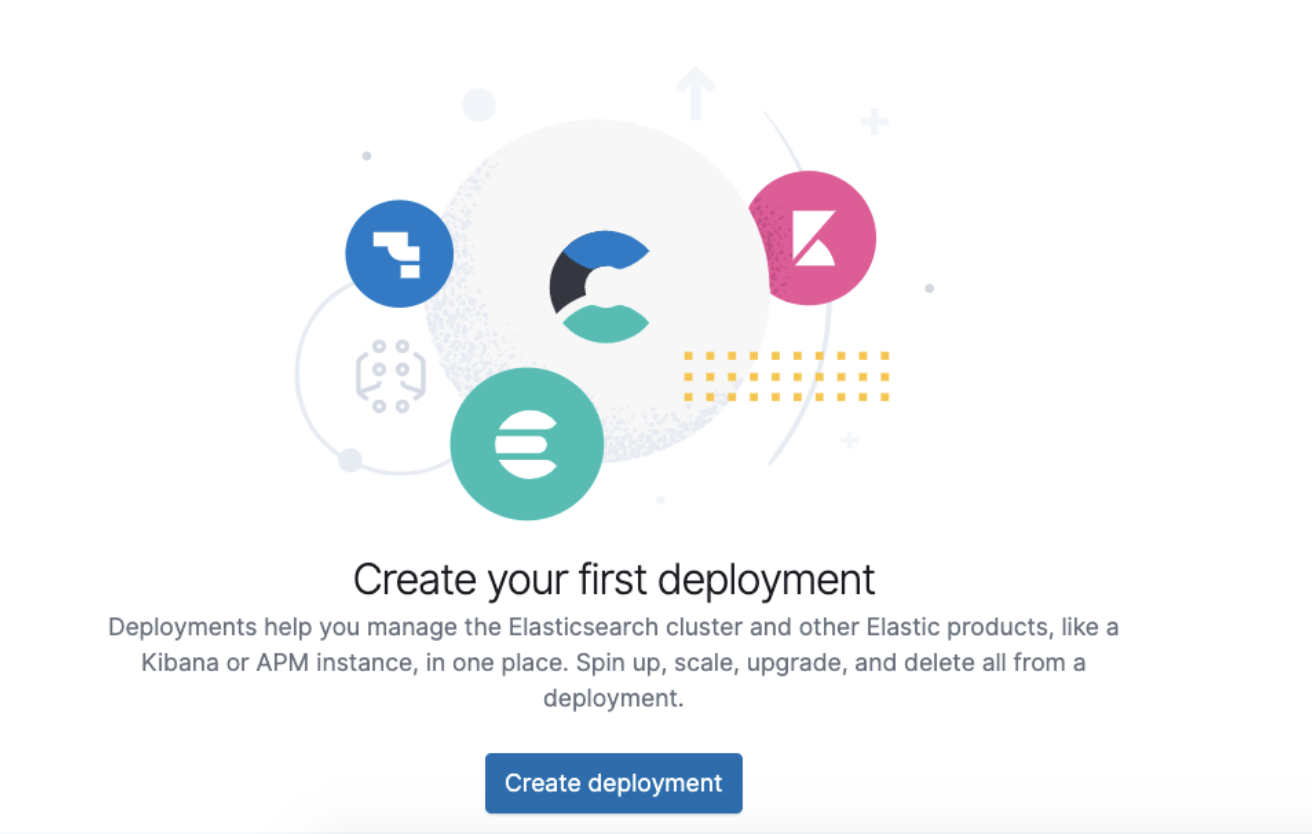
Once logged in, create a new deployment where the Cloudflare logs will reside.
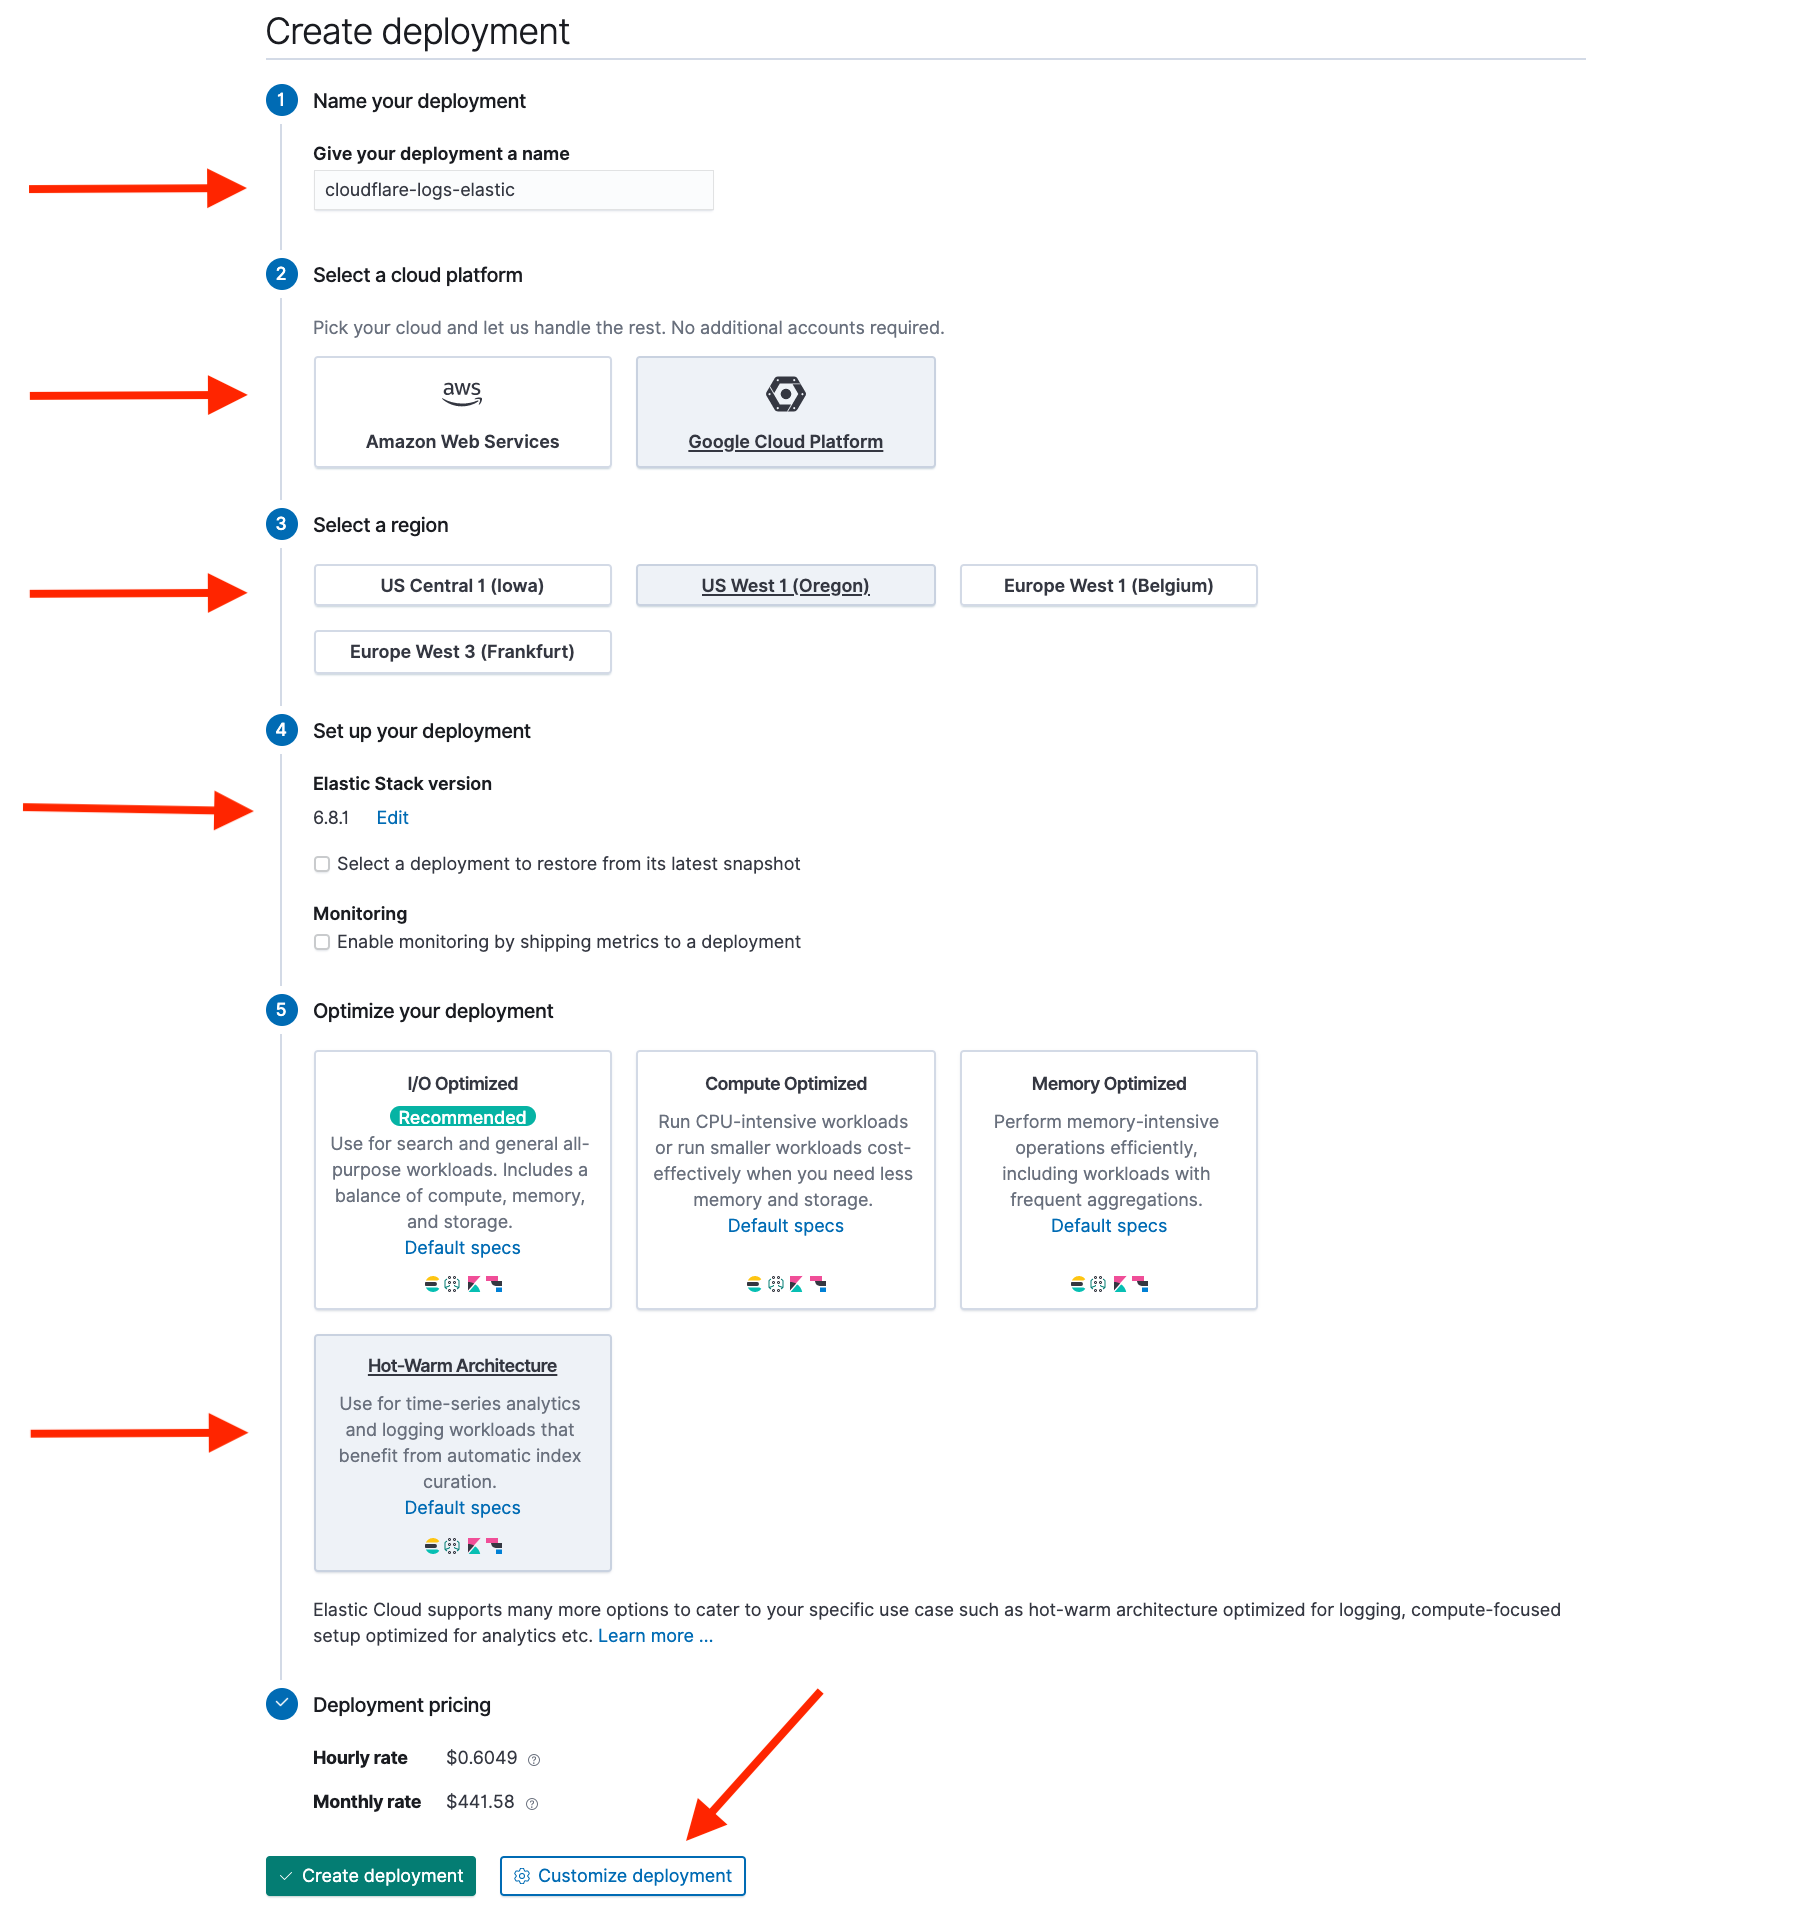
Configure your new deployment with the following parameters:
Name: cloudflare-elastic-logs
Cloud provider: Amazon Web Services or Google Cloud Platform
Region: Geographical region in which to host the deployment
Version: Choose version 6.x or 7.x
Template: Choose Hot-Warm Architecture (recommended) or I/O Optimize
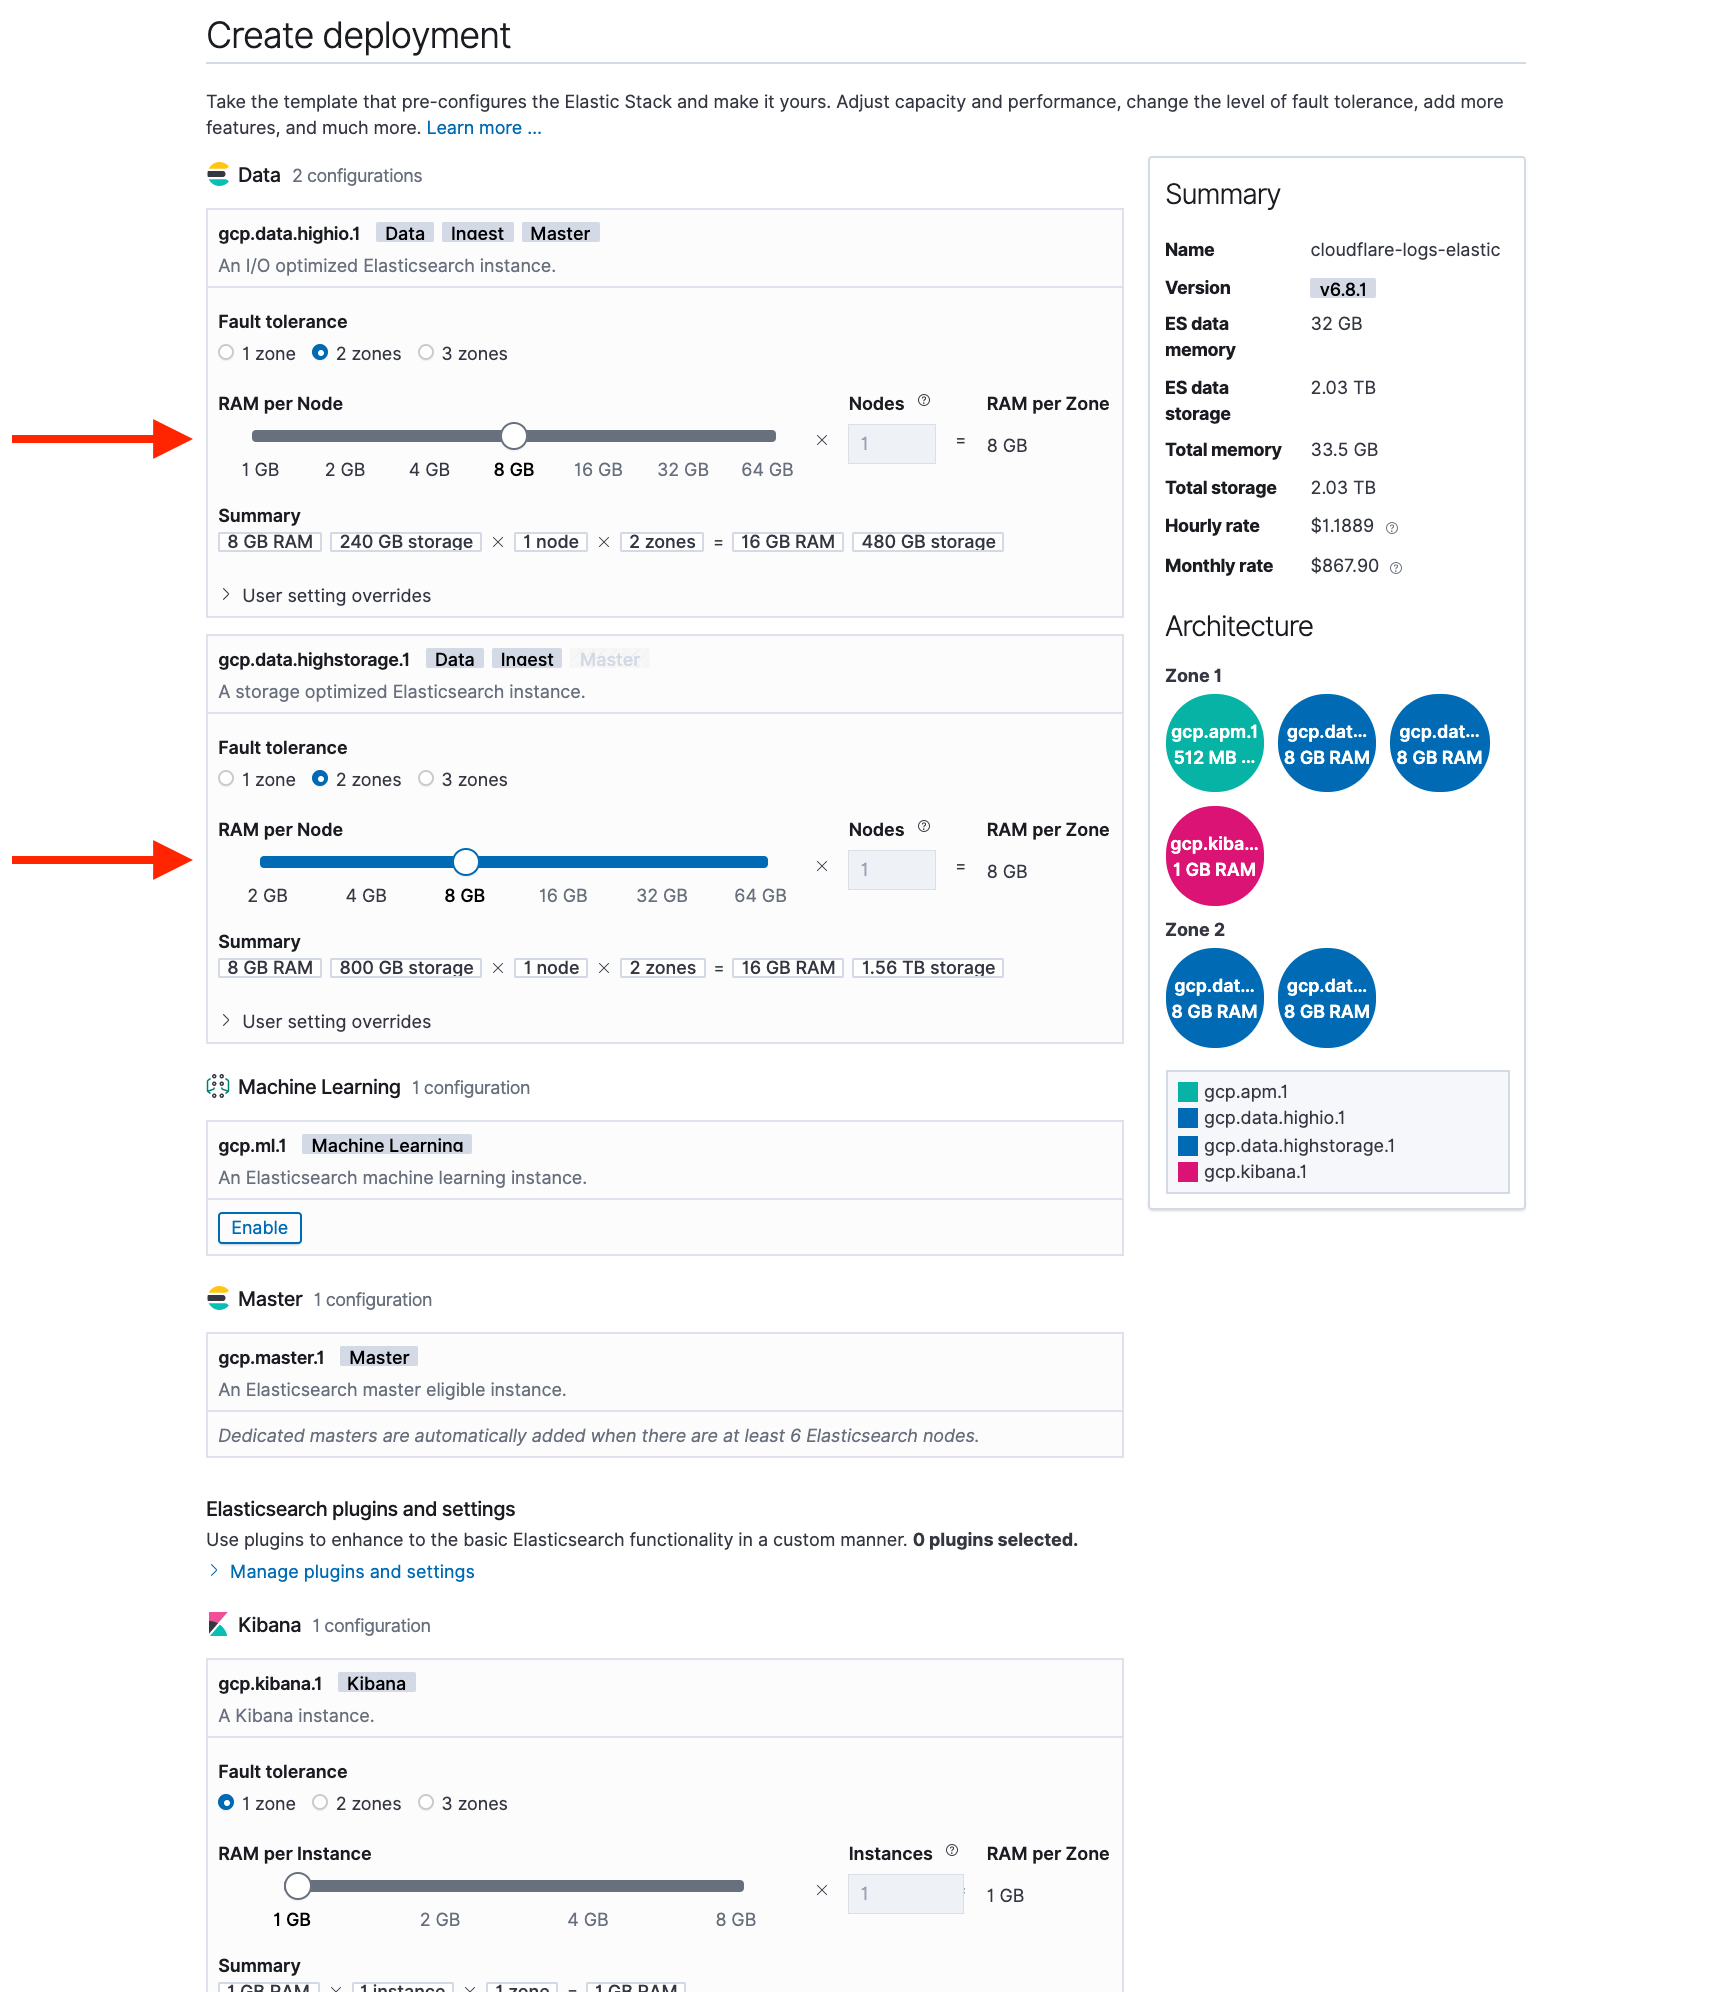
Click Customize Deployment. On this page, you can set your Elasticsearch cluster memory and storage.
I/O Optimized Template Configuration
For this options, we recommend configuring your cluster to have 2 availability zones and 8 GB of RAM.
Hot-Warm Template Configuration
For this option, we recommend configuring your cluster as:
Hot Zone: 2 availability zones, 8 GB RAM
Warm Zone: 2 availability zones, 8 GB RAM
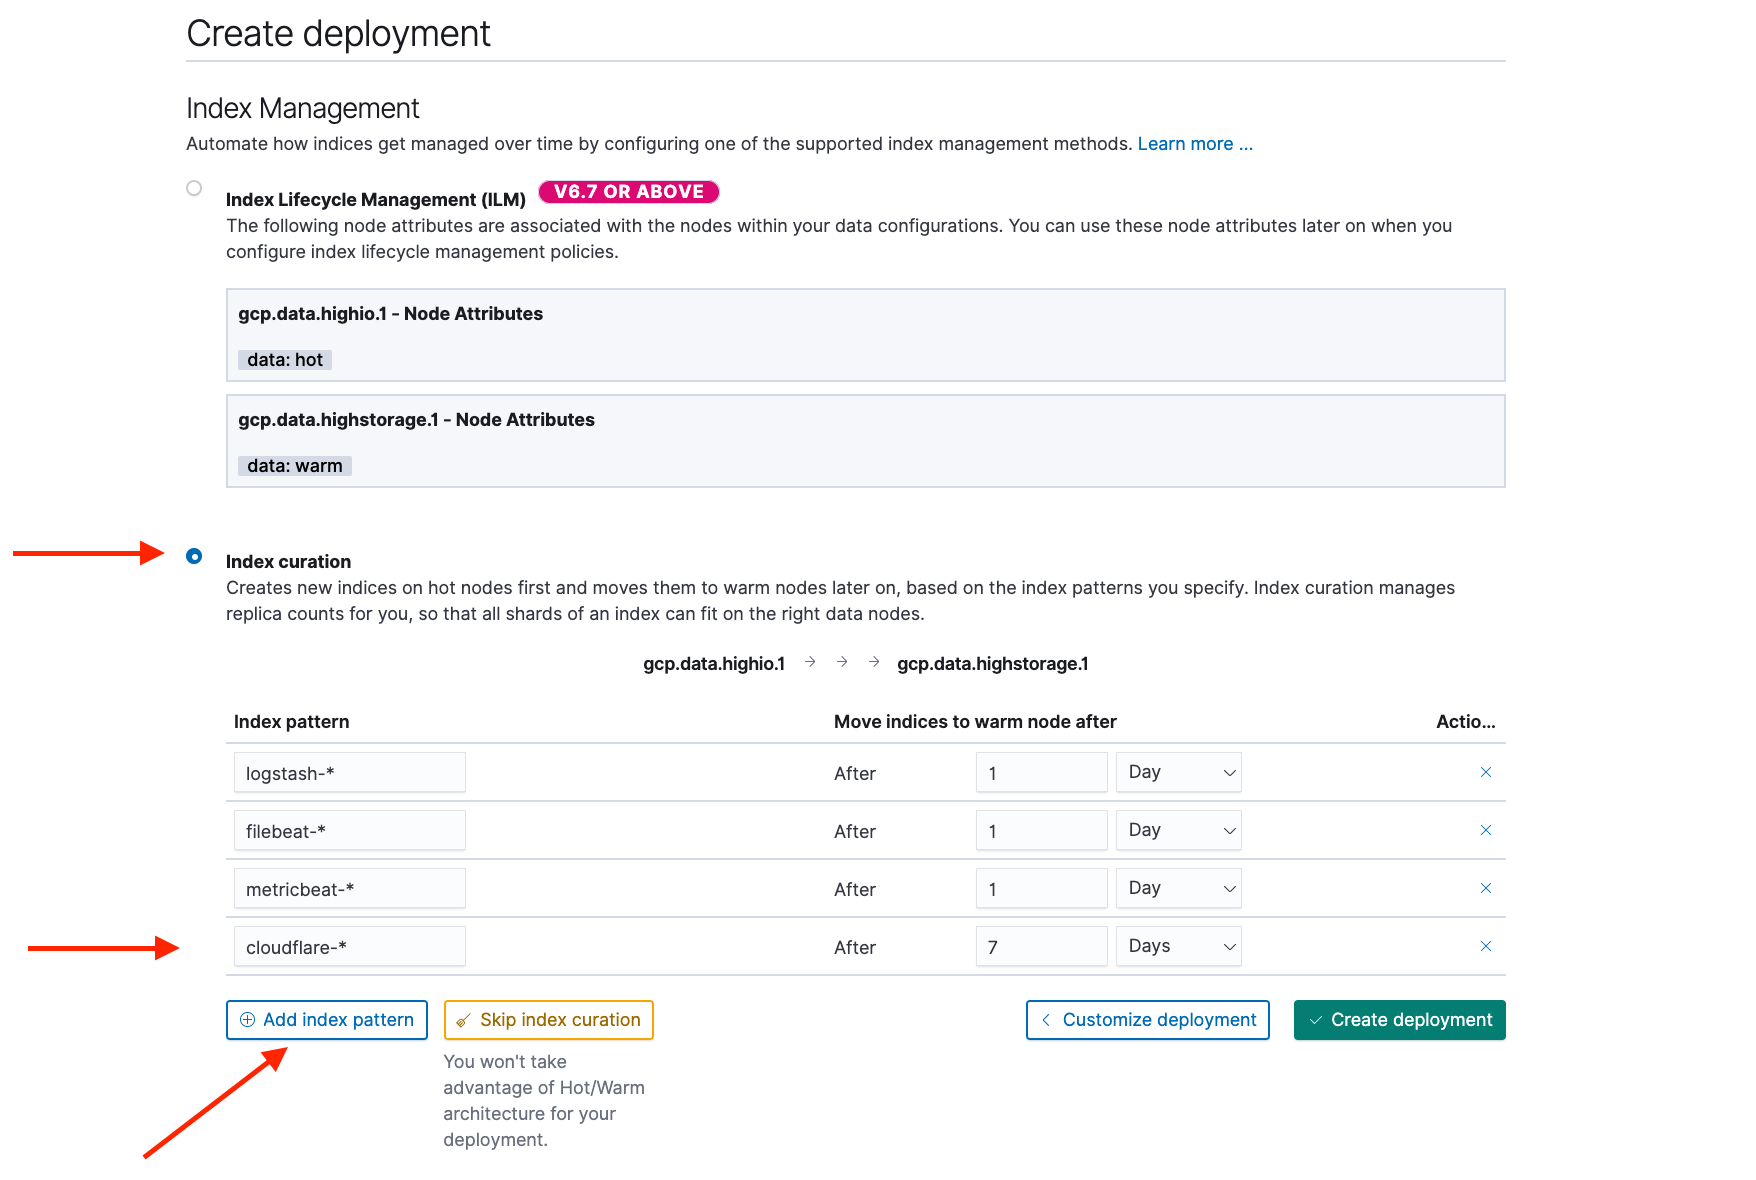
In a hot-warm template, the system will automatically manage the data lifecycle for you by migrating old data to less expensive storage. To configure this, click Configure index management.
Add an index pattern for cloudflare-* and set it to migrate data off the hot zone after 7 days.
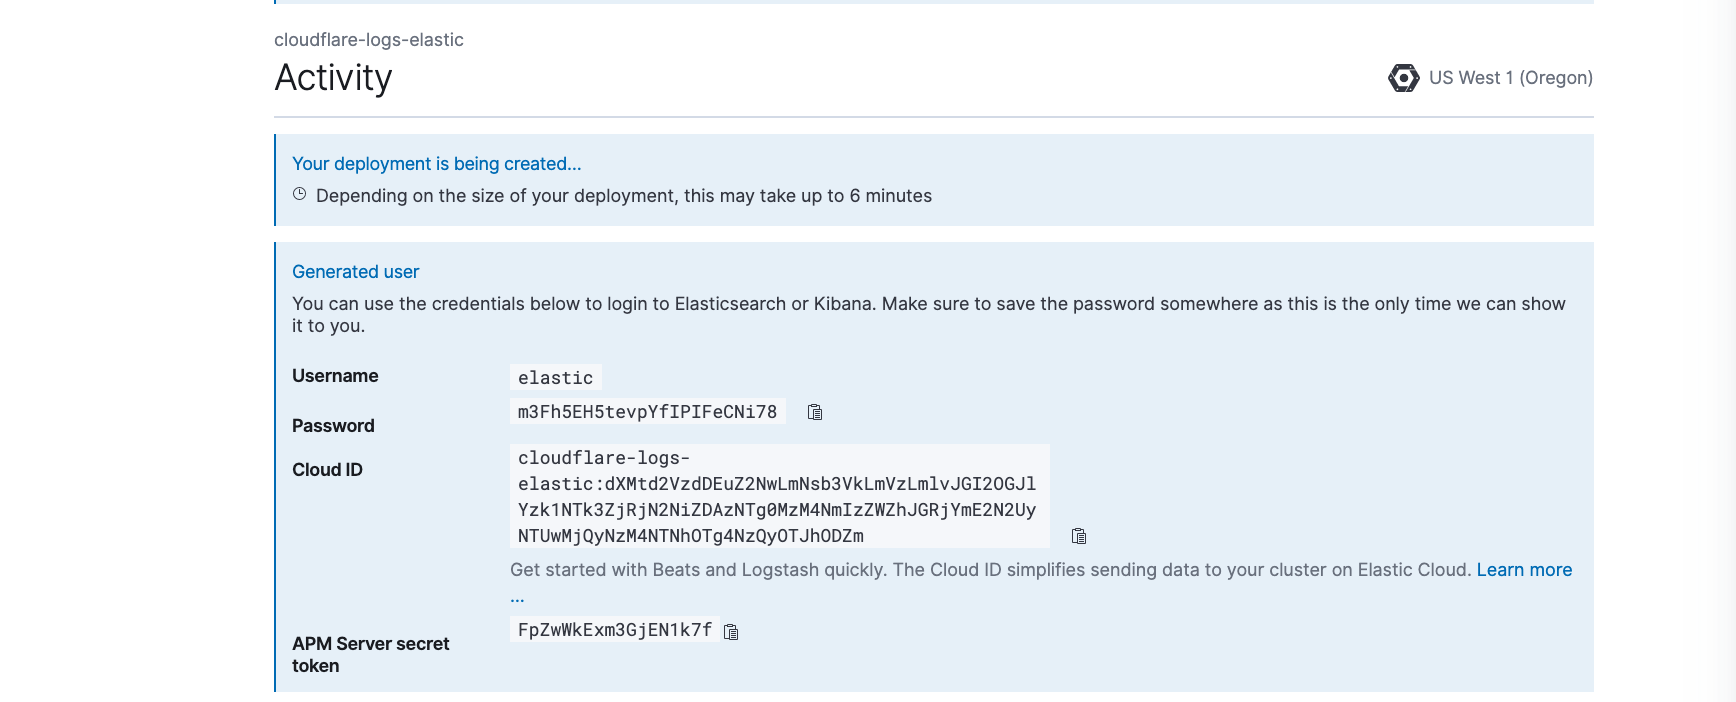
You are now ready to create your Elastic deployment. Click Create deployment. The page will refresh with details of your new cluster. It is important to save the randomly generated password (see screenshot). All Elastic deployments are secure by default and are bootstrapped with a randomly generated password for the Elastic user. You will use this password to log in to view your Cloudflare logs.
Using the Elasticsearch endpoint for your new deployment (found on the main page), run the following command from a terminal, using the random password from above.
Install the function: create the Lambda, which will read Cloudflare logs from S3 and import them into your Elastic cluster.
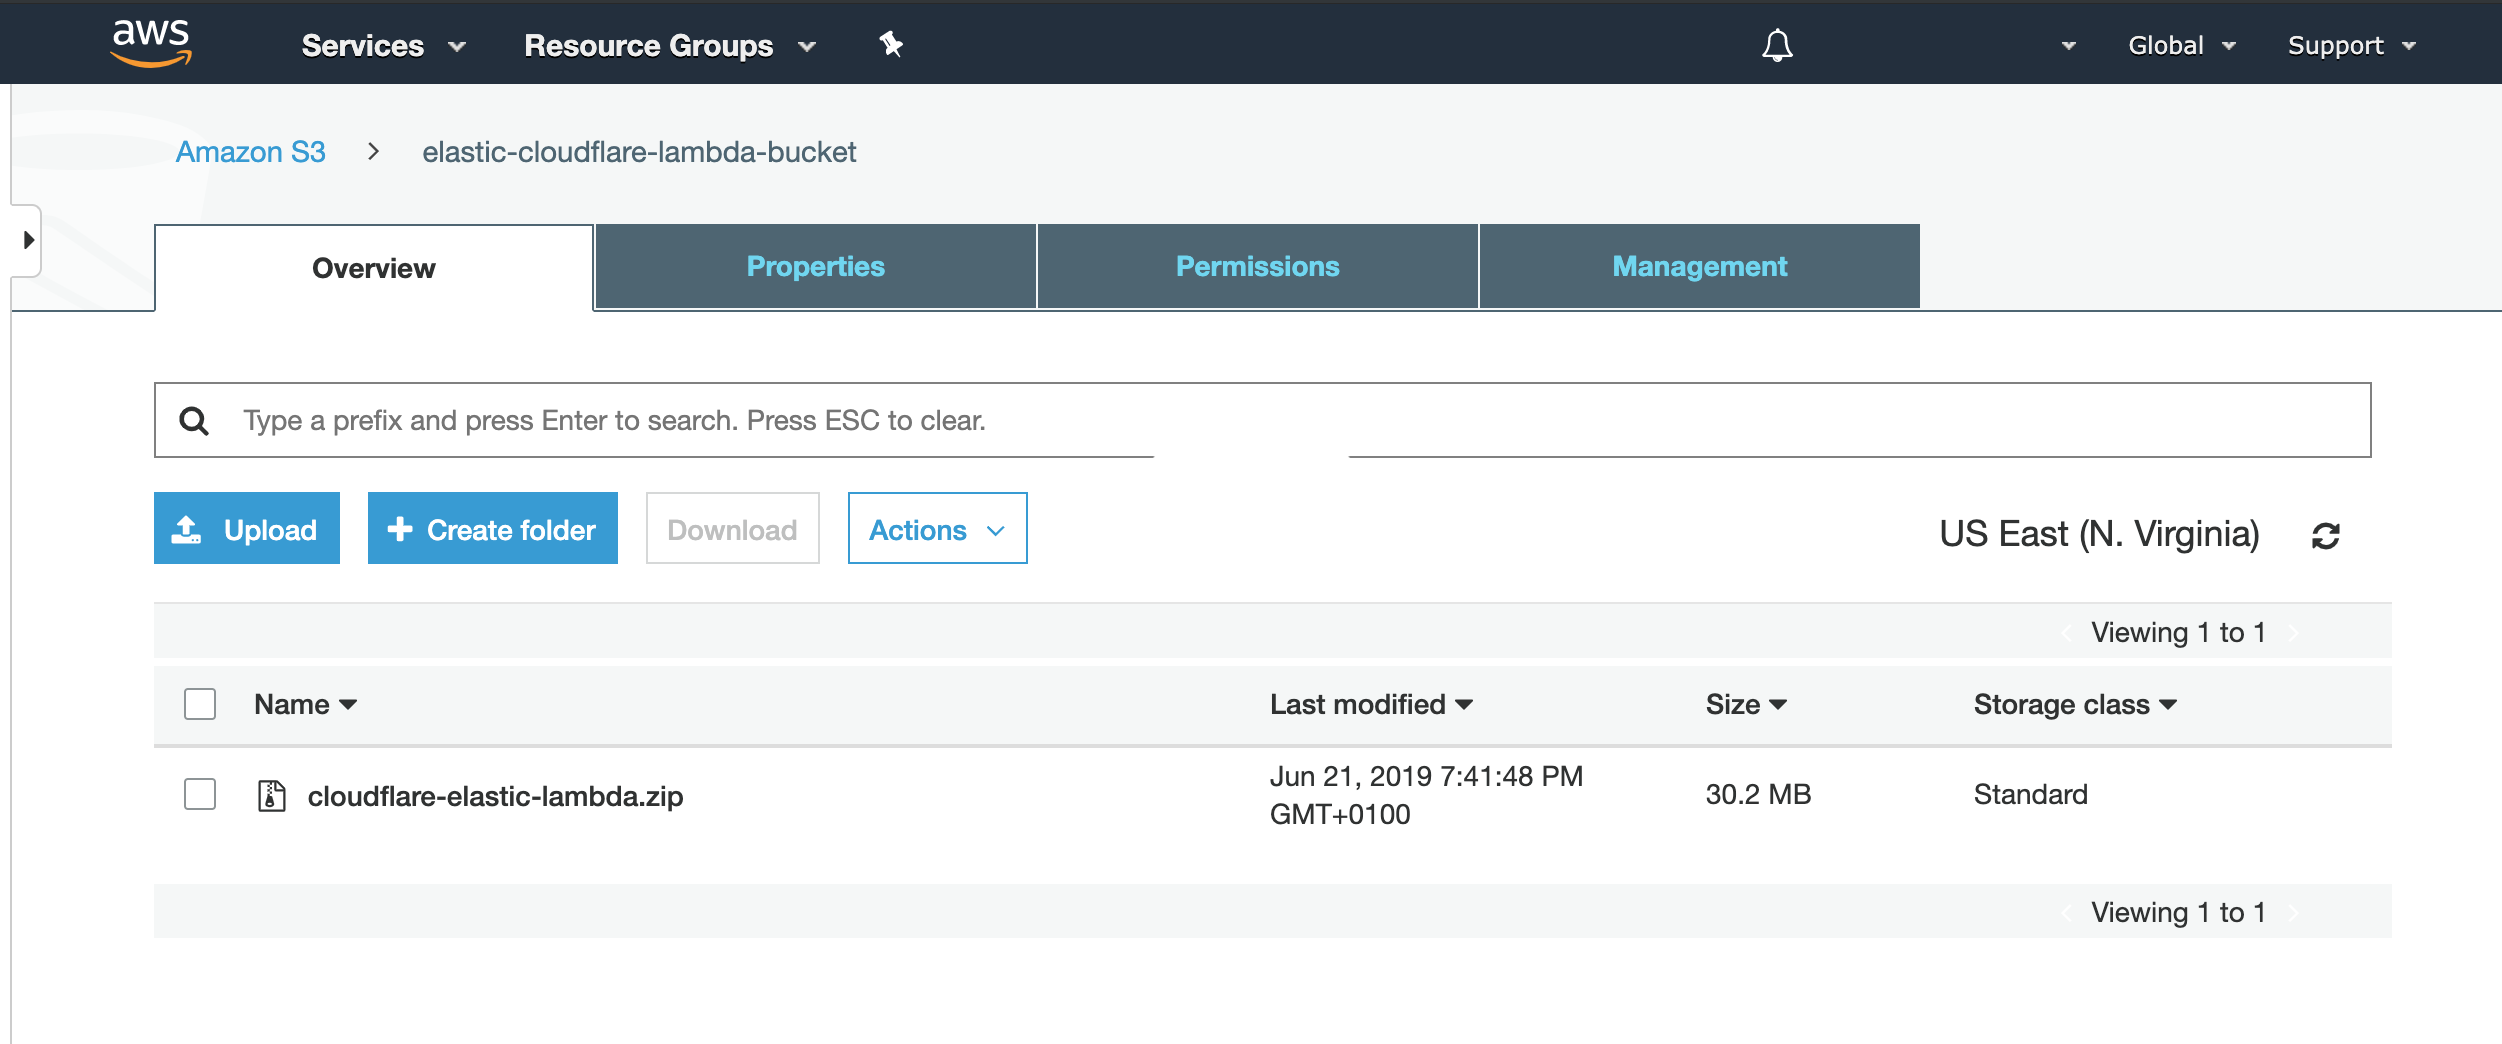
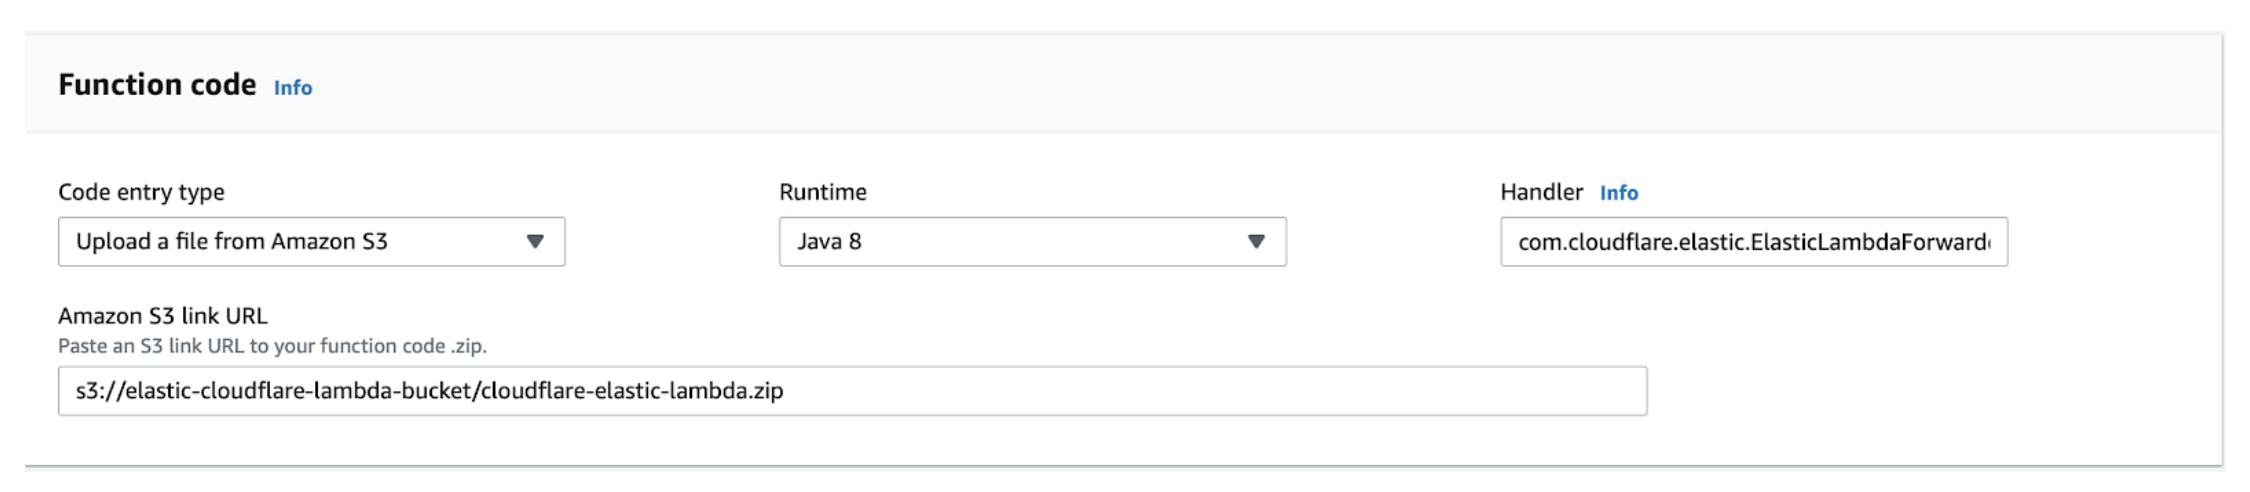
Log in to your AWS console and navigate to the Lambda section. Create a new function, using the Java 8 runtime and give it a name such as cloudflare-elastic-logs.
Configure the handler as com.cloudflare.elastic.ElasticLambdaForwarder::handleRequest and upload the function that we had previously saved to our S3 bucket.
Configure the function. The Lambda function requires the following environment variables:
elastic_hostname: Copy the Elasticsearch endpoint URL from your deployment. Remove the port number and https:// prefix; for example: 2202aa790db546268248a5bd1e35aea6.us-west1.gcp.cloud.es.io.
elastic_username: Enter elastic.
elastic_password: Use the randomly generated password that was created for you.
To connect your Cloudflare S3 log bucket. the last step is to tell the Lambda function to listen for events on the S3 bucket where your Cloudflare logs reside. Choose the S3 trigger type and configure it with the name of the S3 bucket. For Event type, select All object create events.
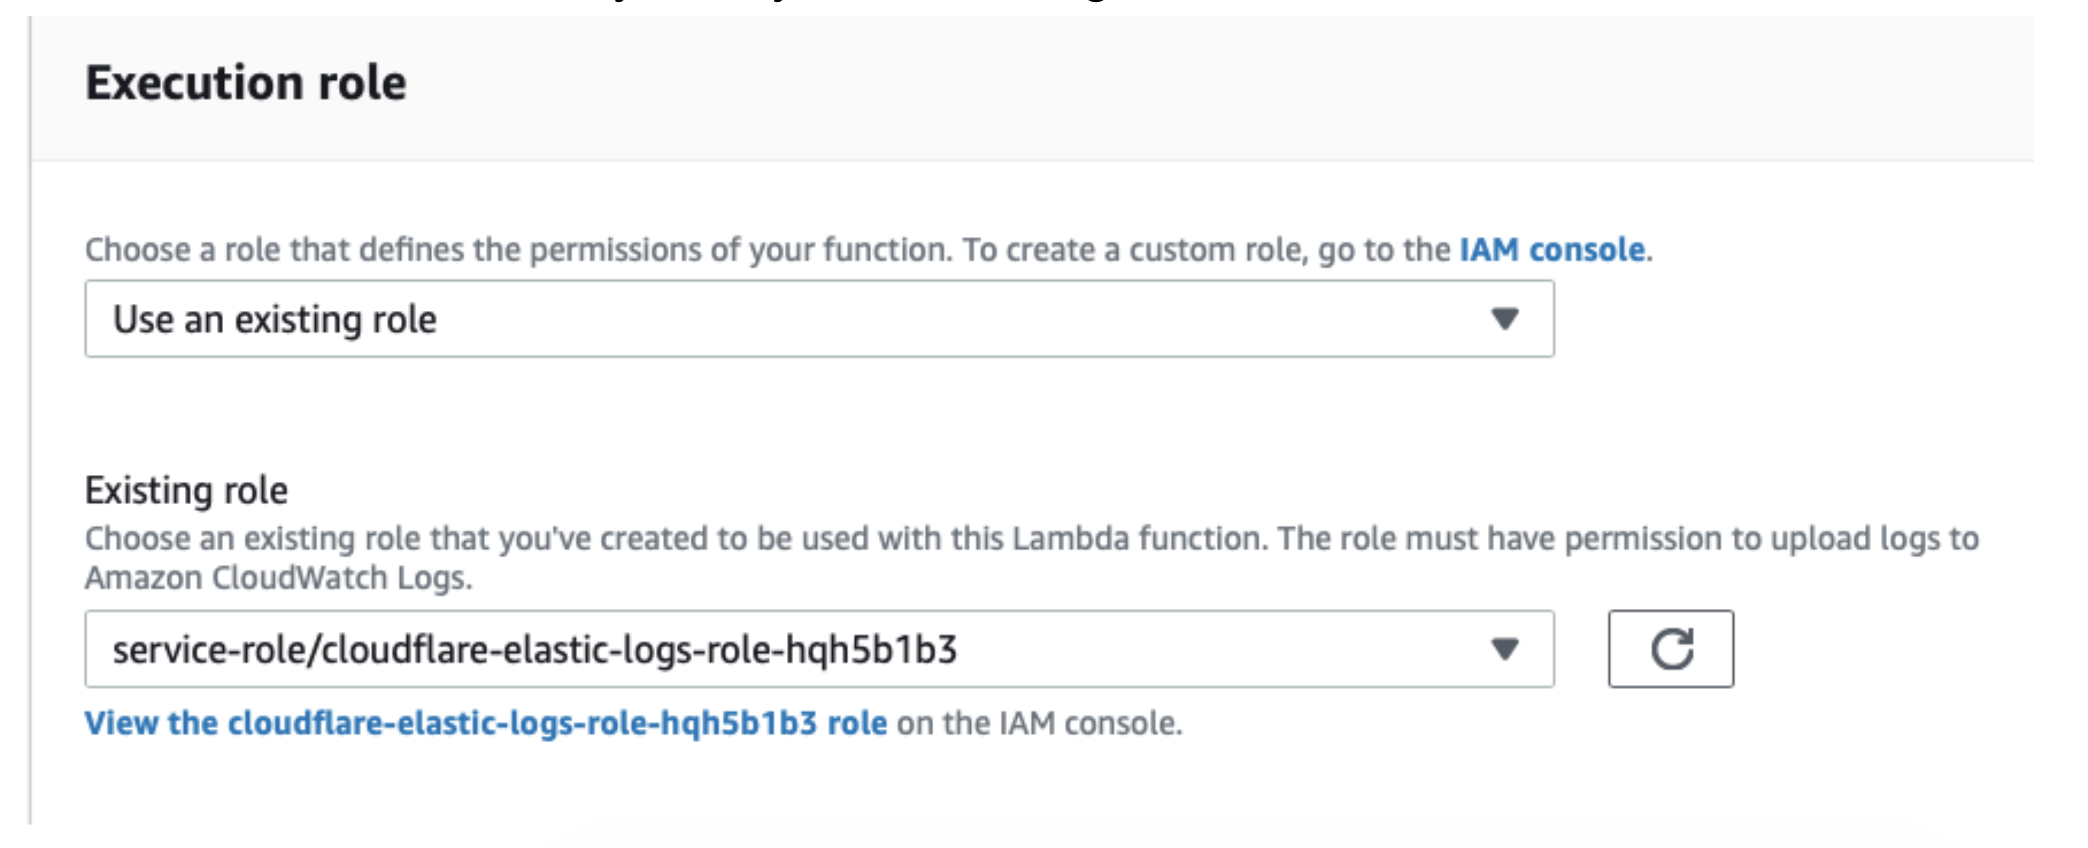
Ensure your execution role is configured. In order for the function to be able to read logs from the S3 bucket, you may have to configure the execution role.
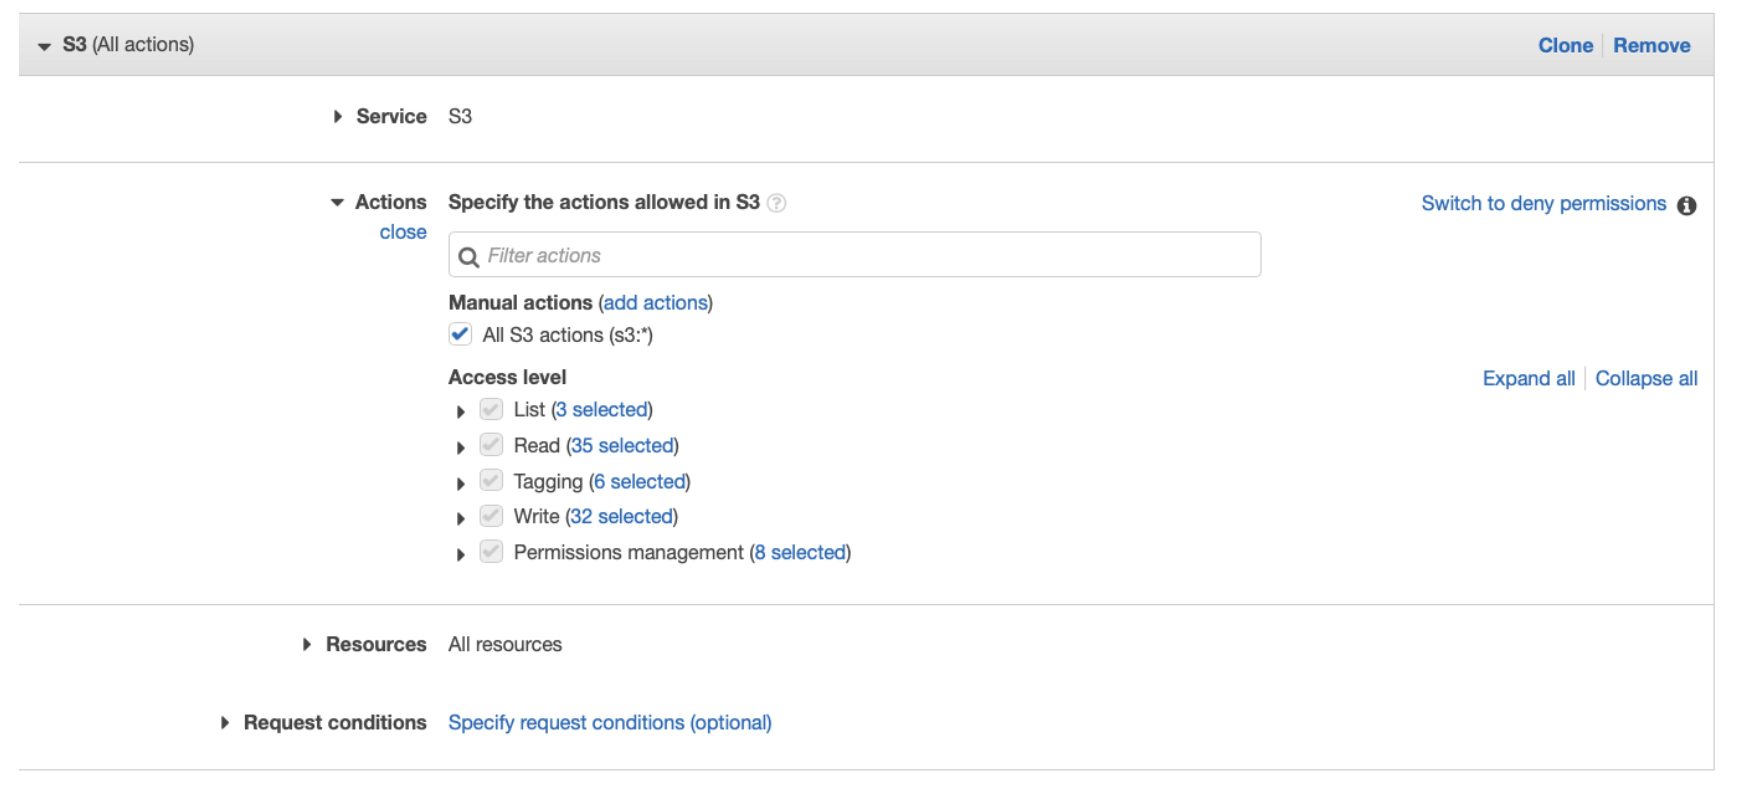
View the execution role and add an inline policy that enables the function to read from the bucket.
Give the policy a name and save it.
Save the Lambda and start logging.
Finally, save the Lambda configuration. Once it is saved, the Cloudflare logs will start showing up in Kibana on your Elastic Cloud deployment.
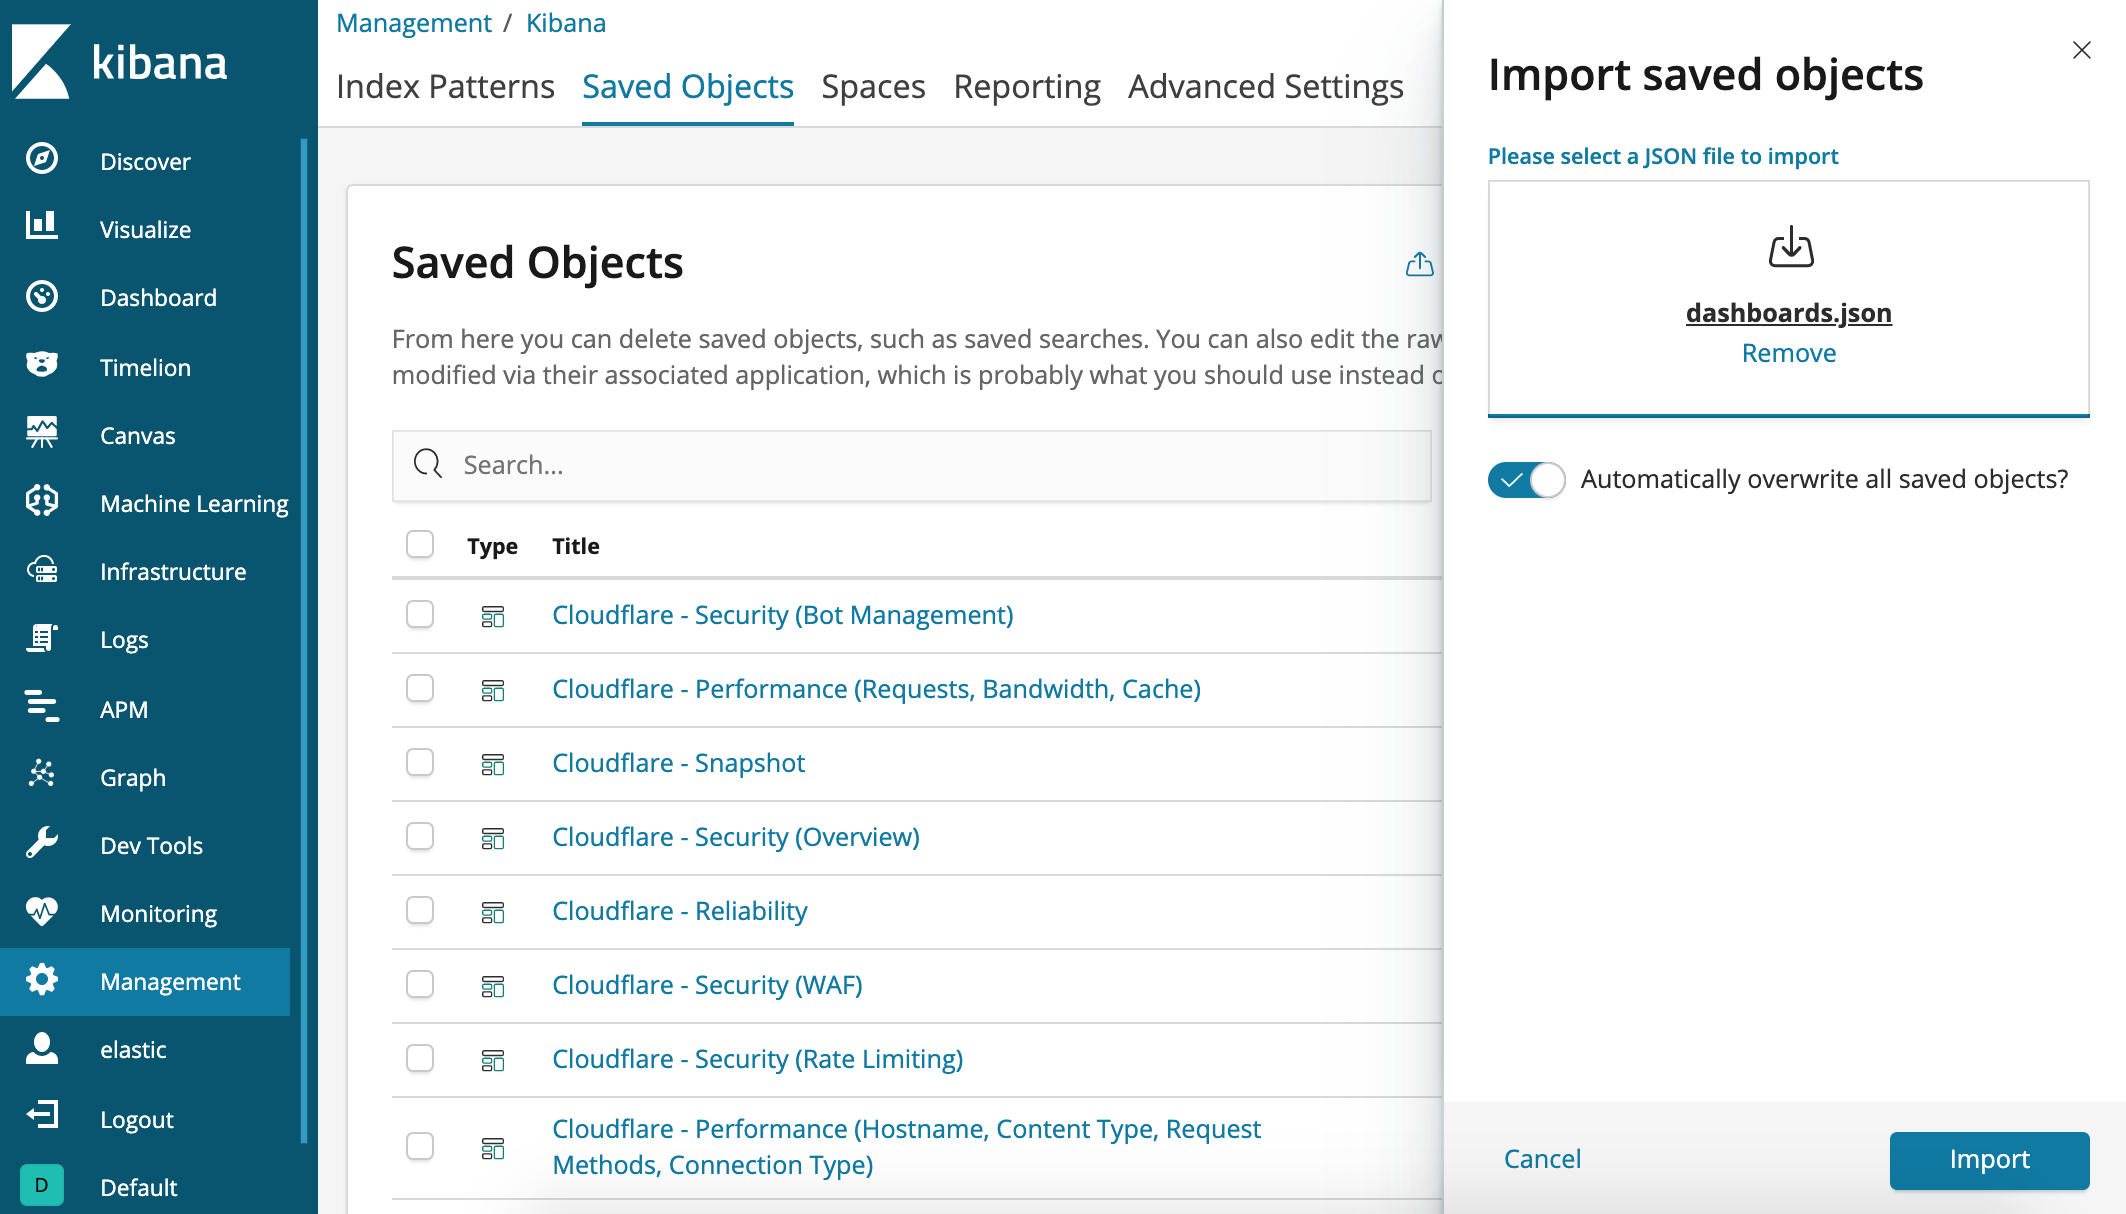
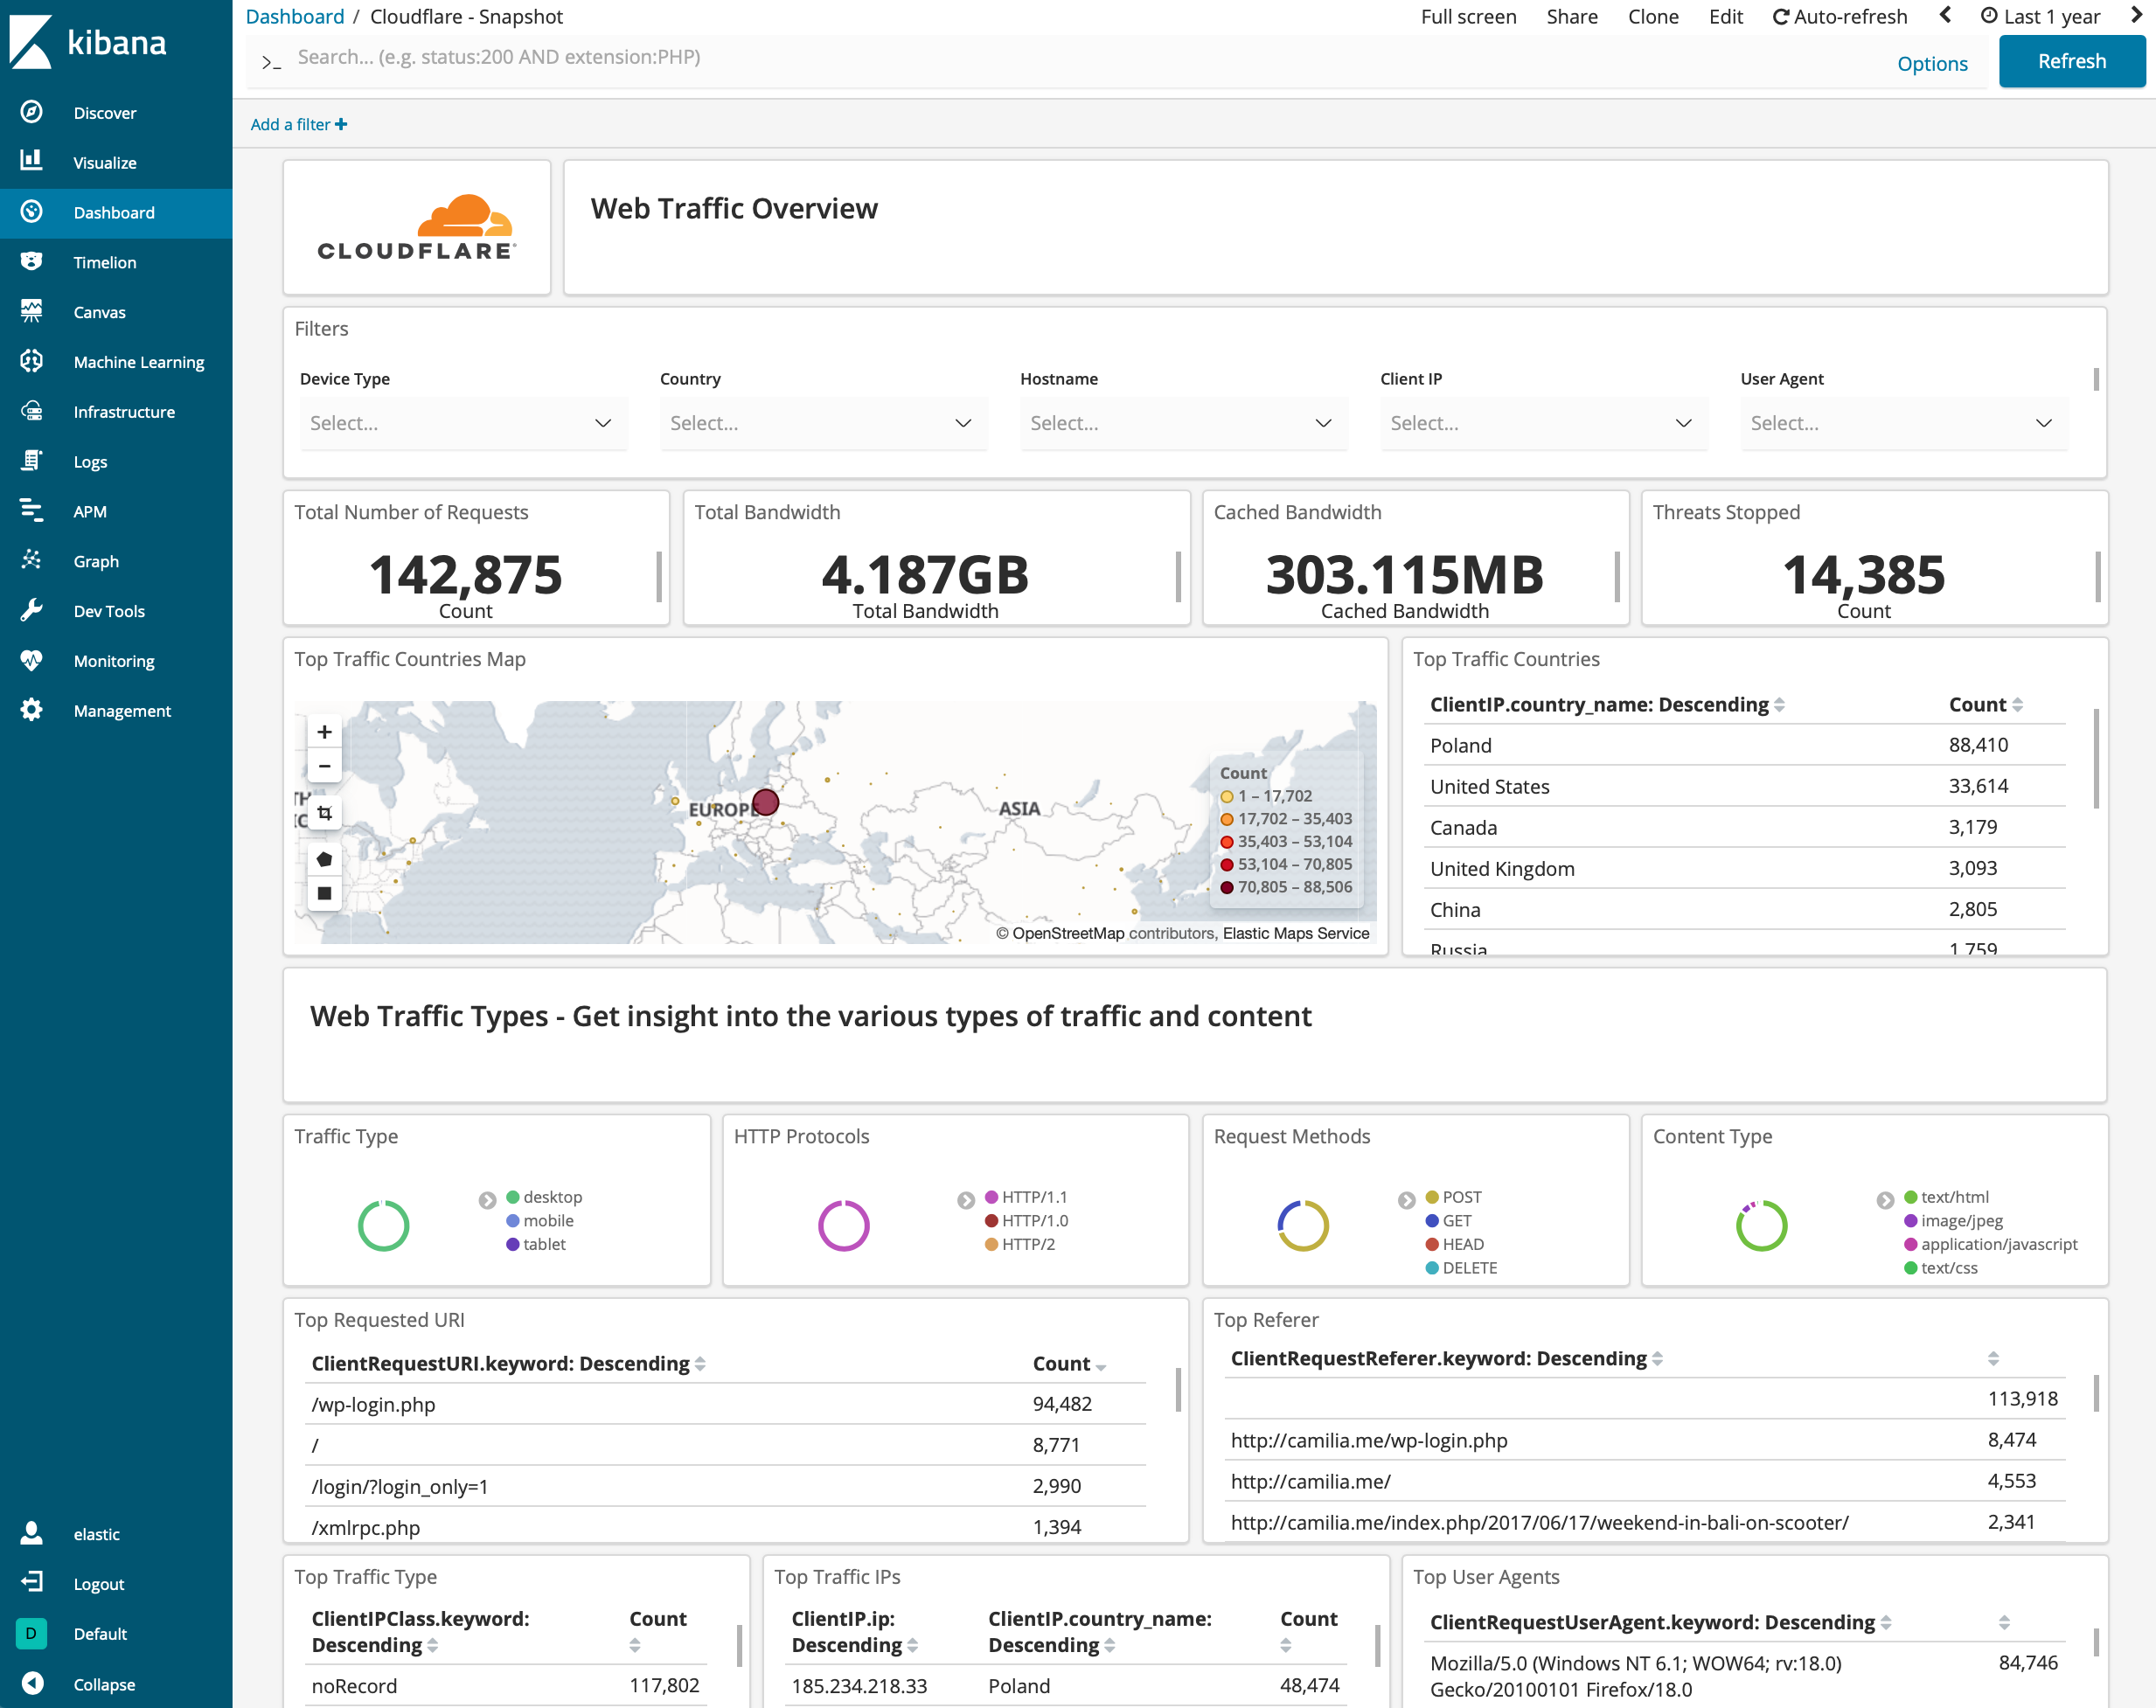
There are nine dashboards to help you analyze Cloudflare logs. You can also use filters within the dashboards to help narrow the analysis by date and time, device type, country, user agent, client IP, hostname, and more. Filtering can further help you with debugging and tracing.
This is a quick overview of the most important metrics from your Cloudflare Logs, including the total number of requests, top visitors by geography, IP, user agent, traffic type, the total number of threats, and bandwidth usage.
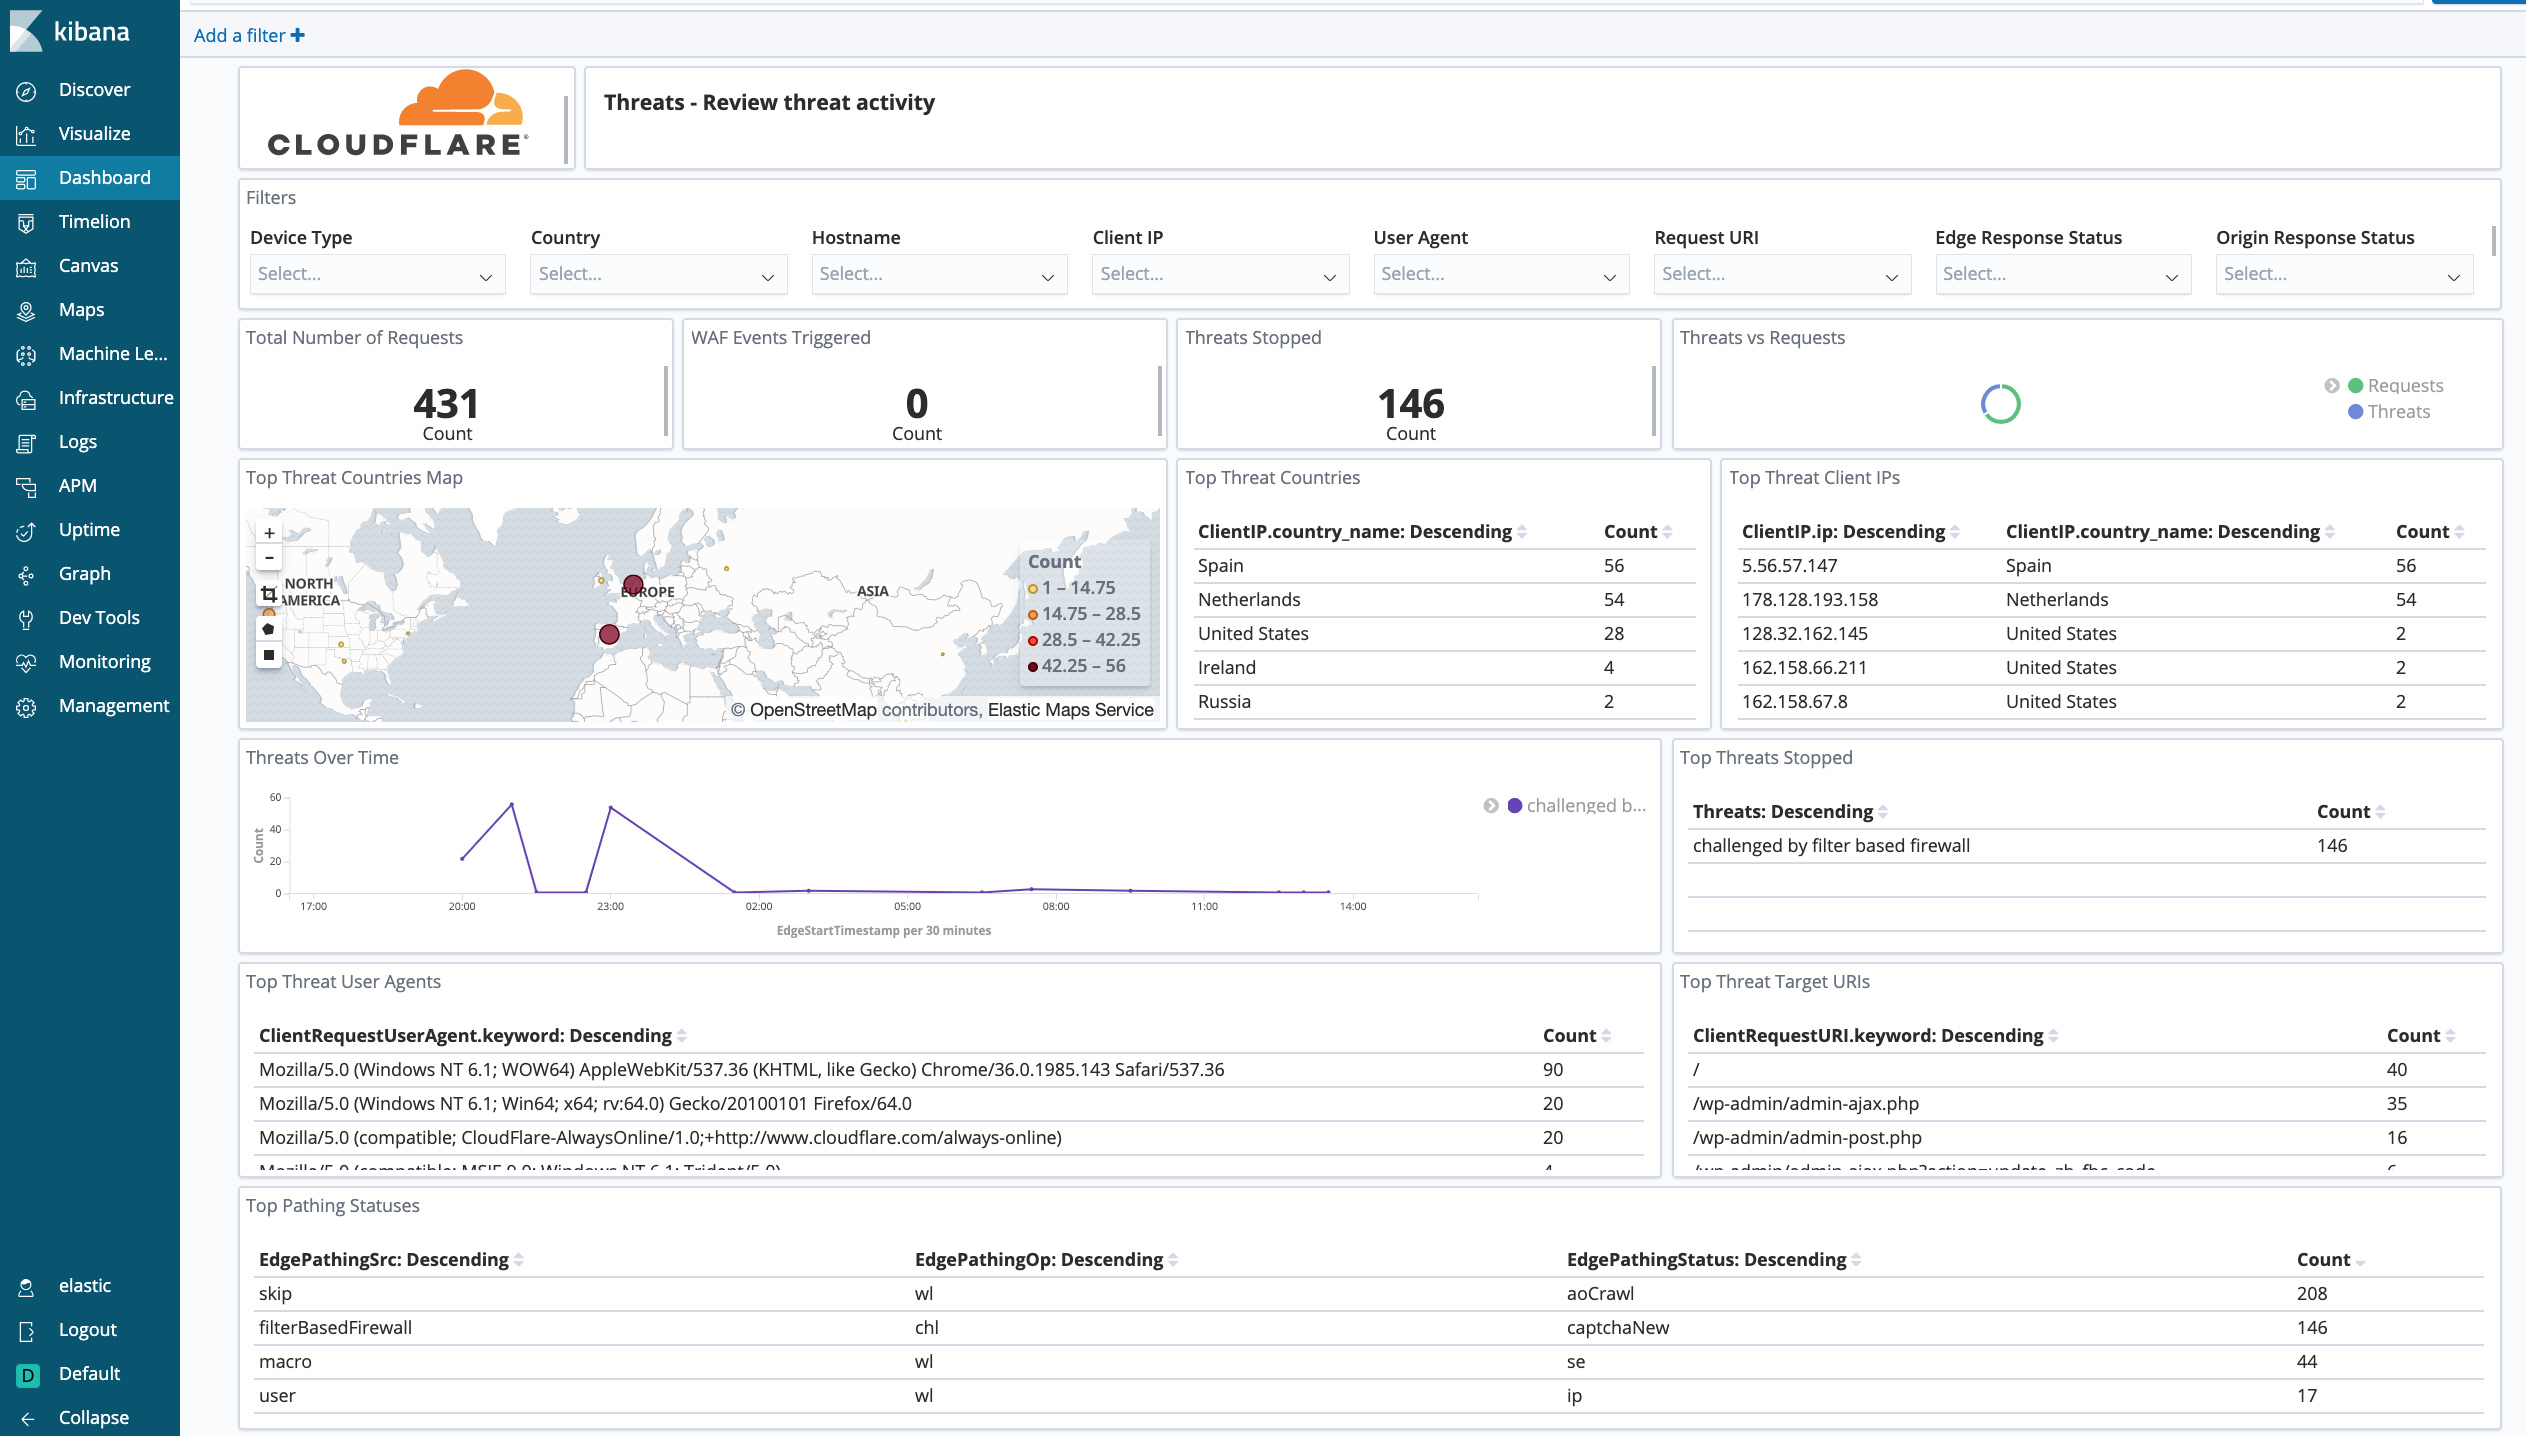
Cloudflare - Security (Overview) - Get insights on threats to your websites and applications, including the number of threats stopped, threats over time, top threat countries, and more.
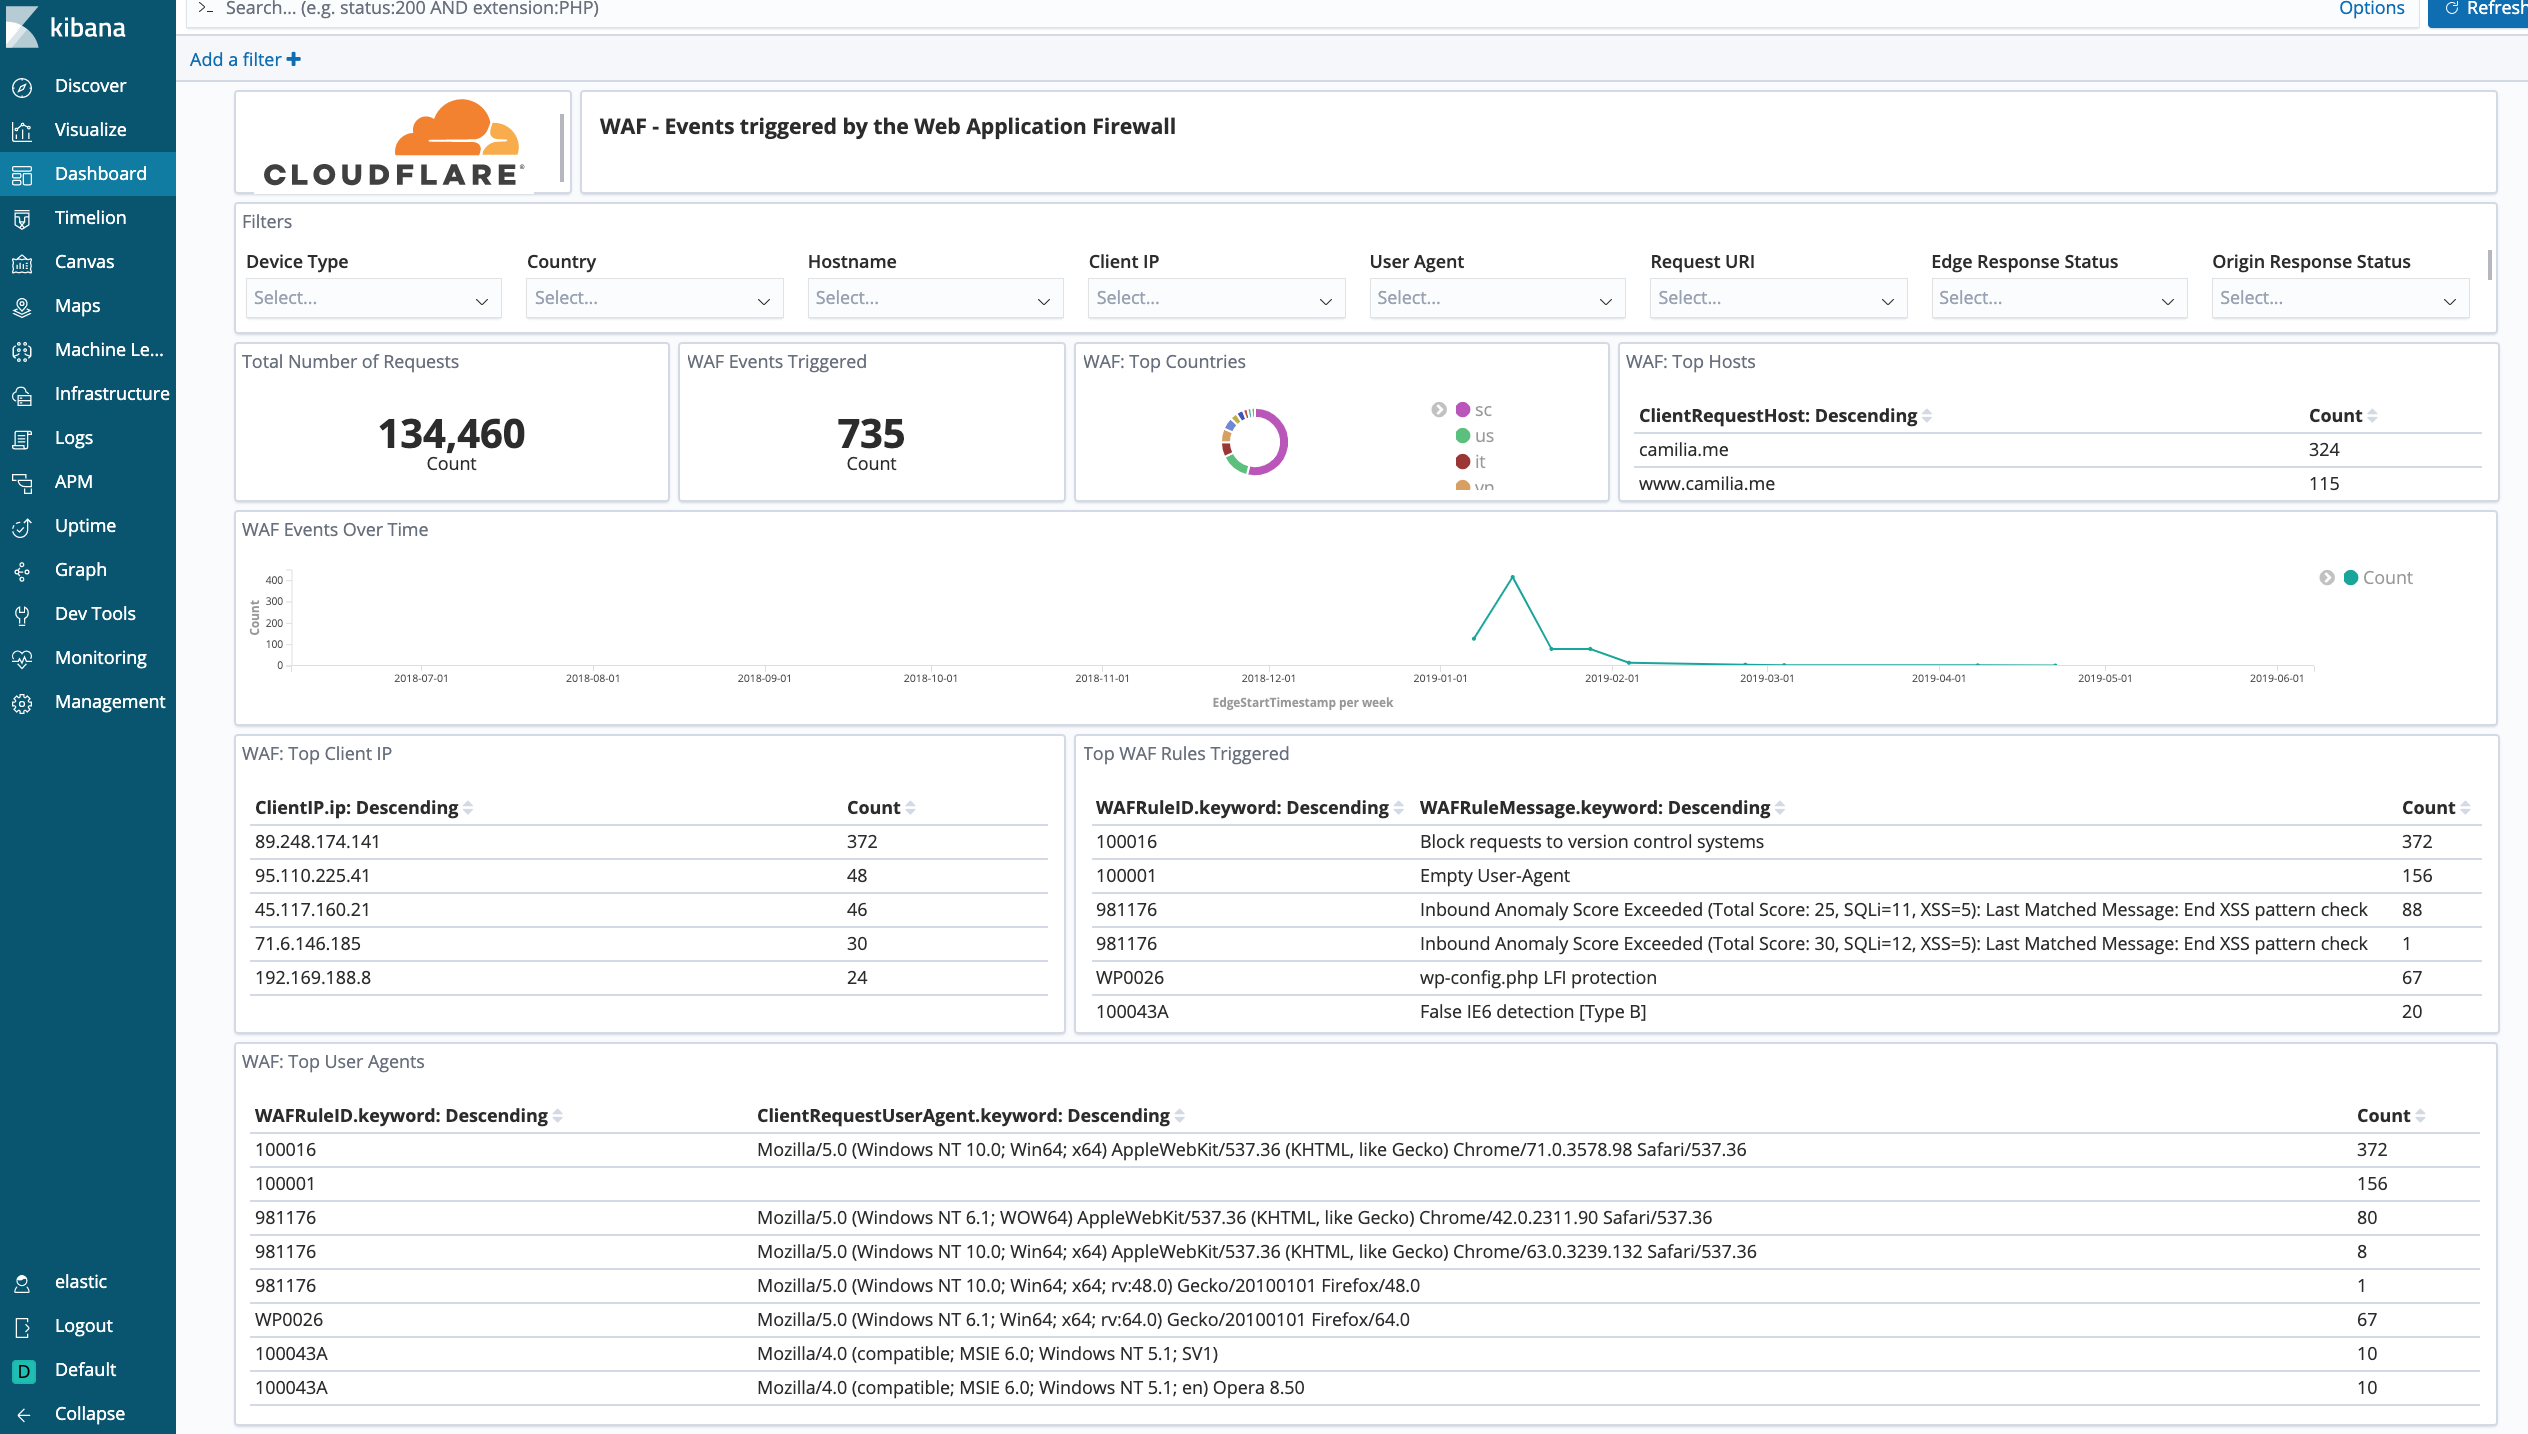
Cloudflare - Security (WAF) - Get insights on threat identification and mitigation by our Web Application Firewall, including events like SQL injections, XSS, and more. Use this data to fine tune the firewall to target obvious threats and prevent false positives.
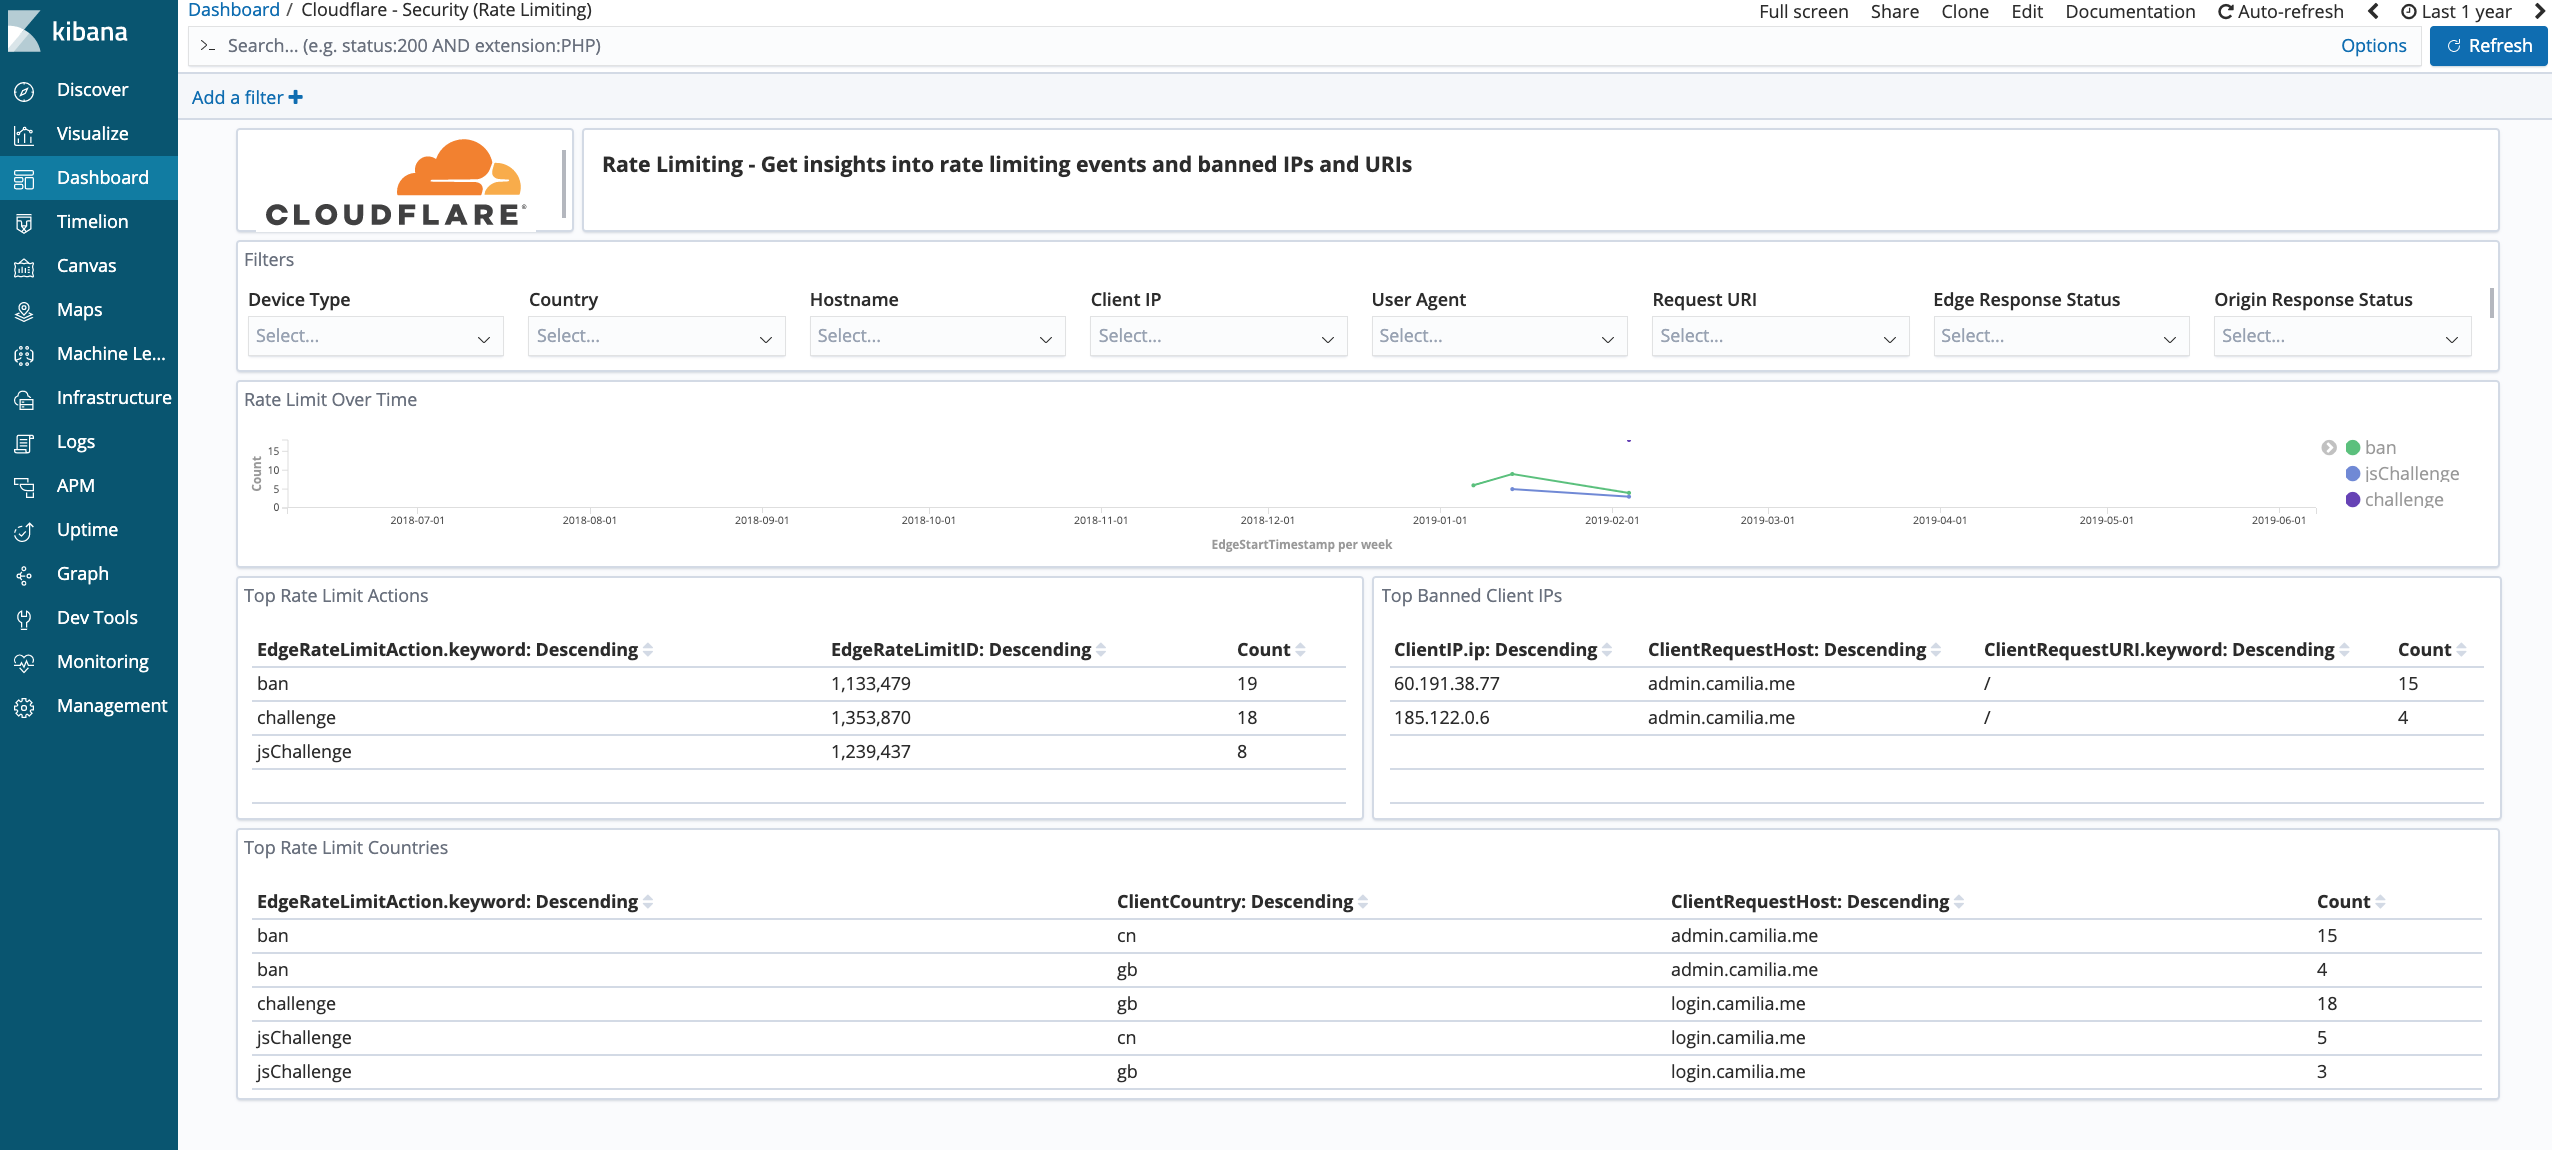
Cloudflare - Security (Rate Limiting) - Get insights on rate limiting protection against denial-of-service attacks, brute-force login attempts, and other types of abusive behavior targeted at your websites or applications.
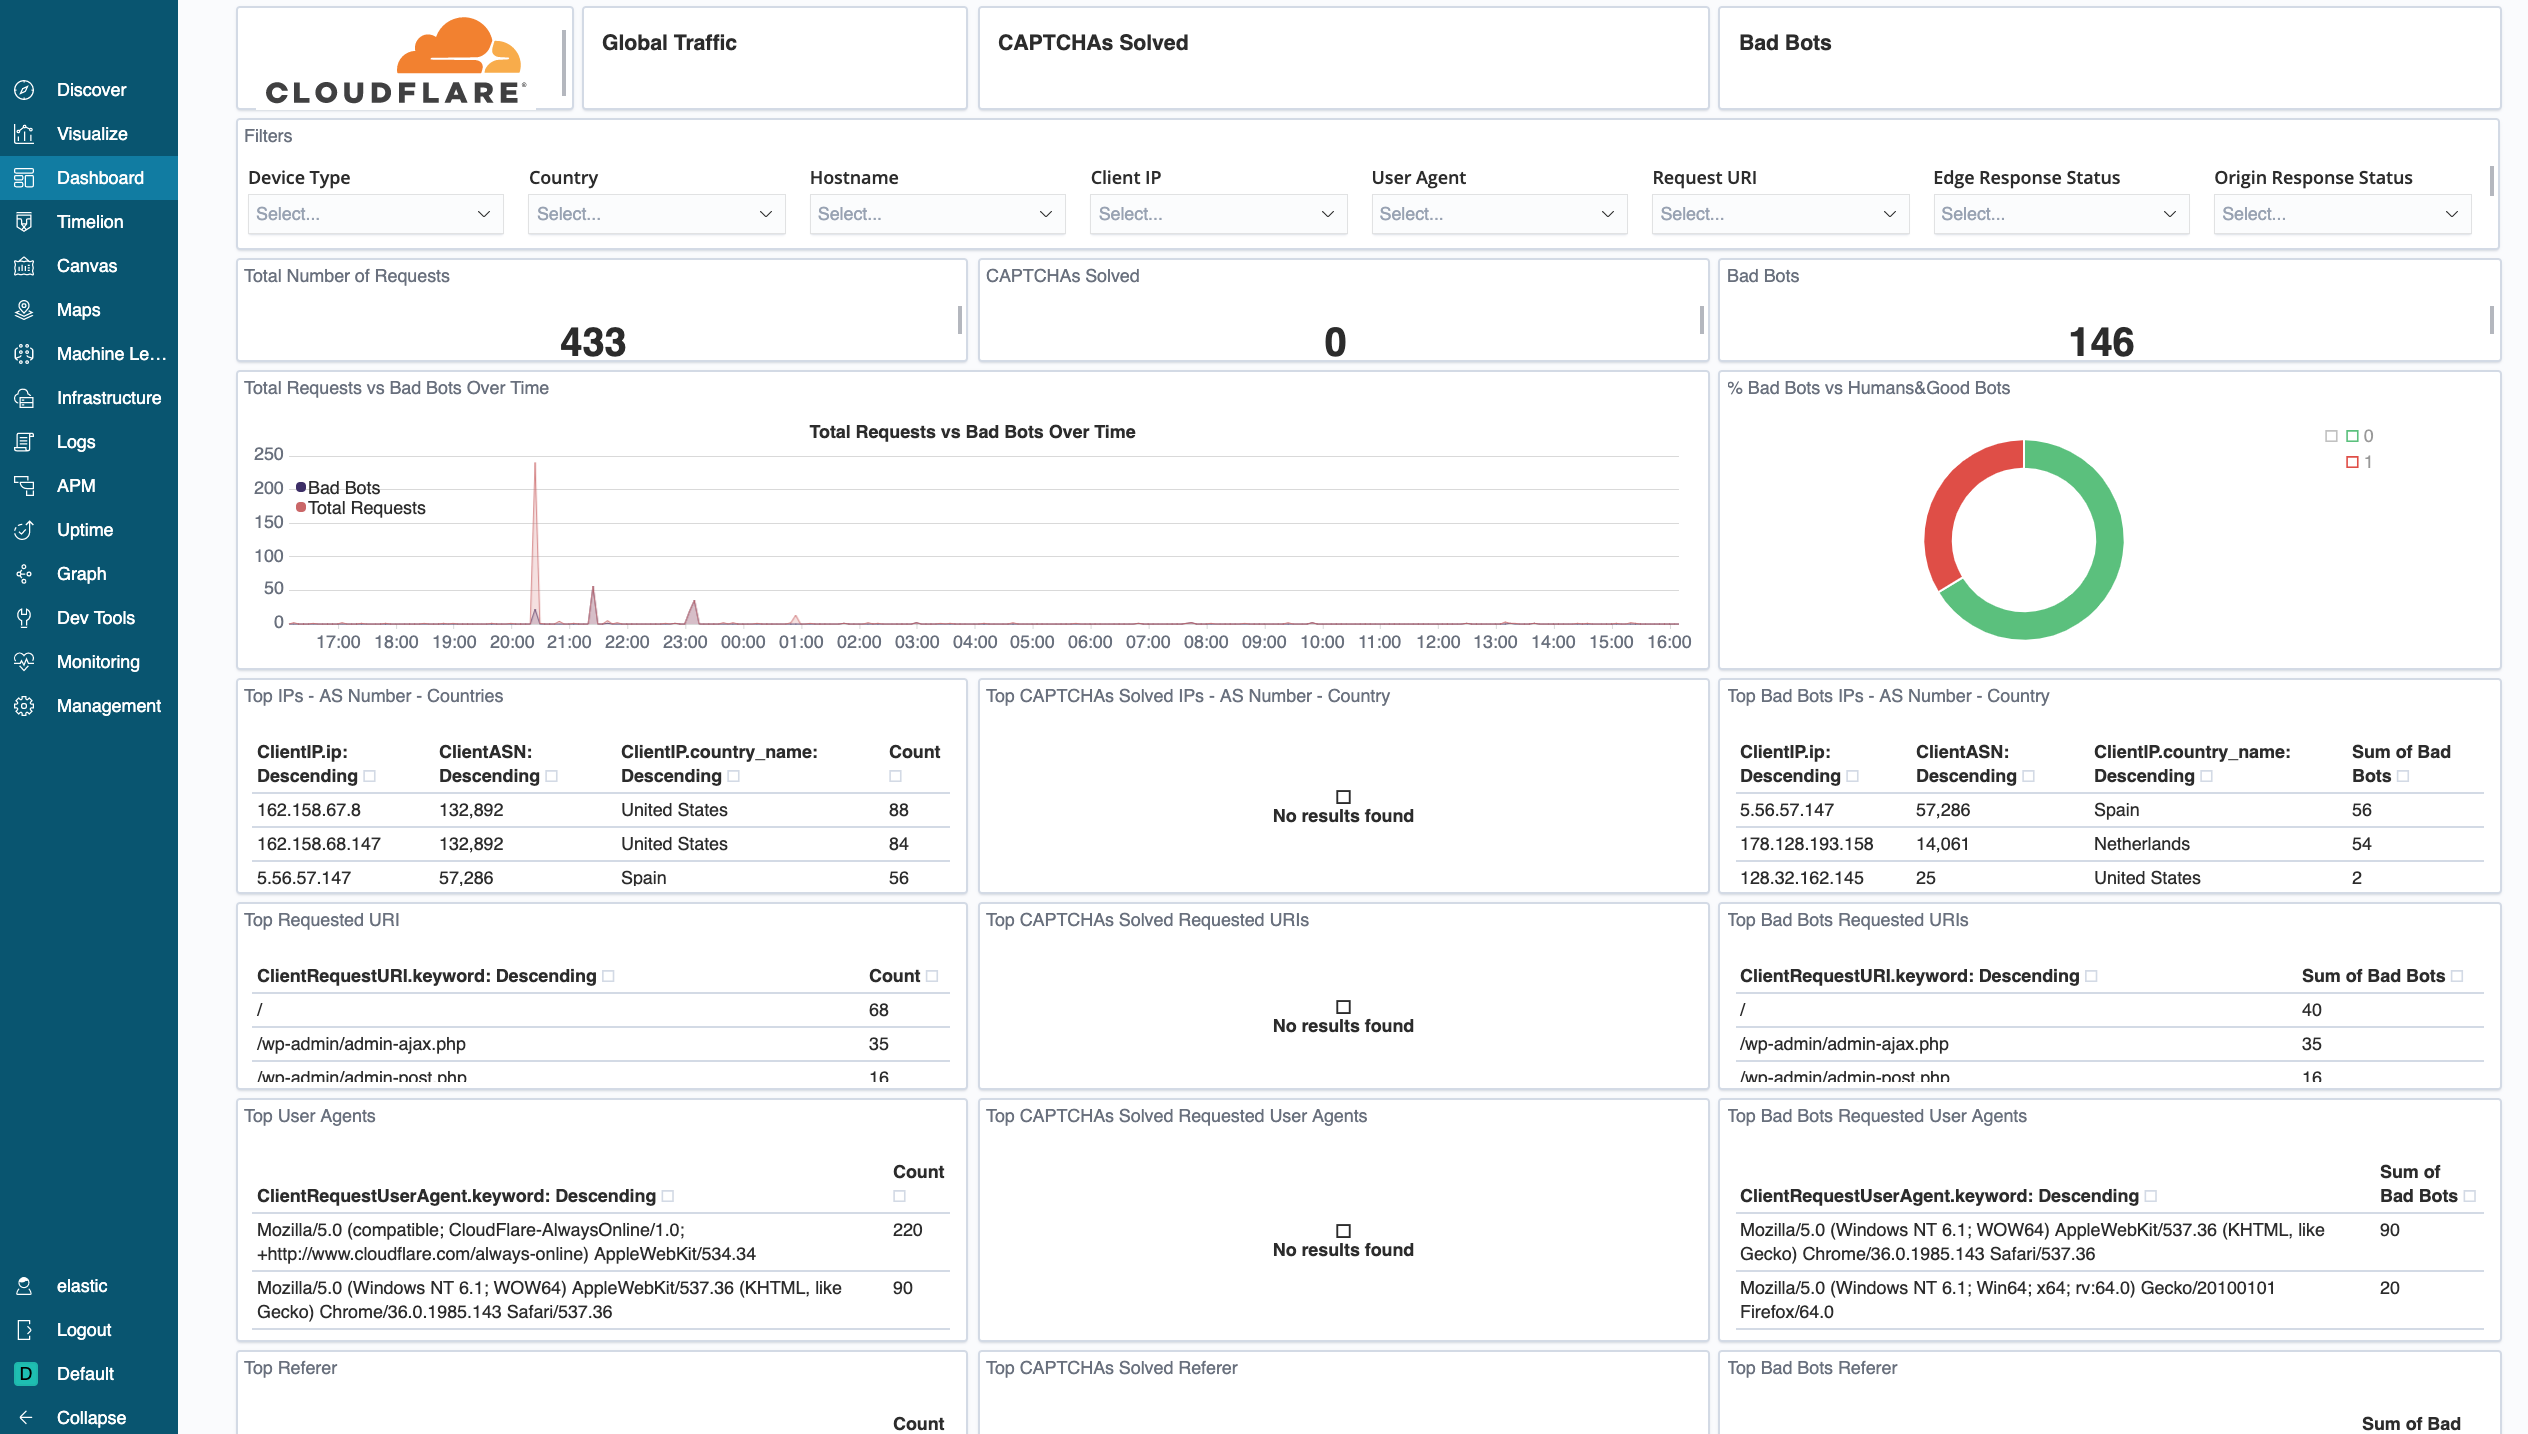
Cloudflare - Security (Bot Management) - Reliably detects and mitigates bad bots to prevent credential stuffing, spam registration, content scraping, click fraud, inventory hoarding, and other malicious activities.
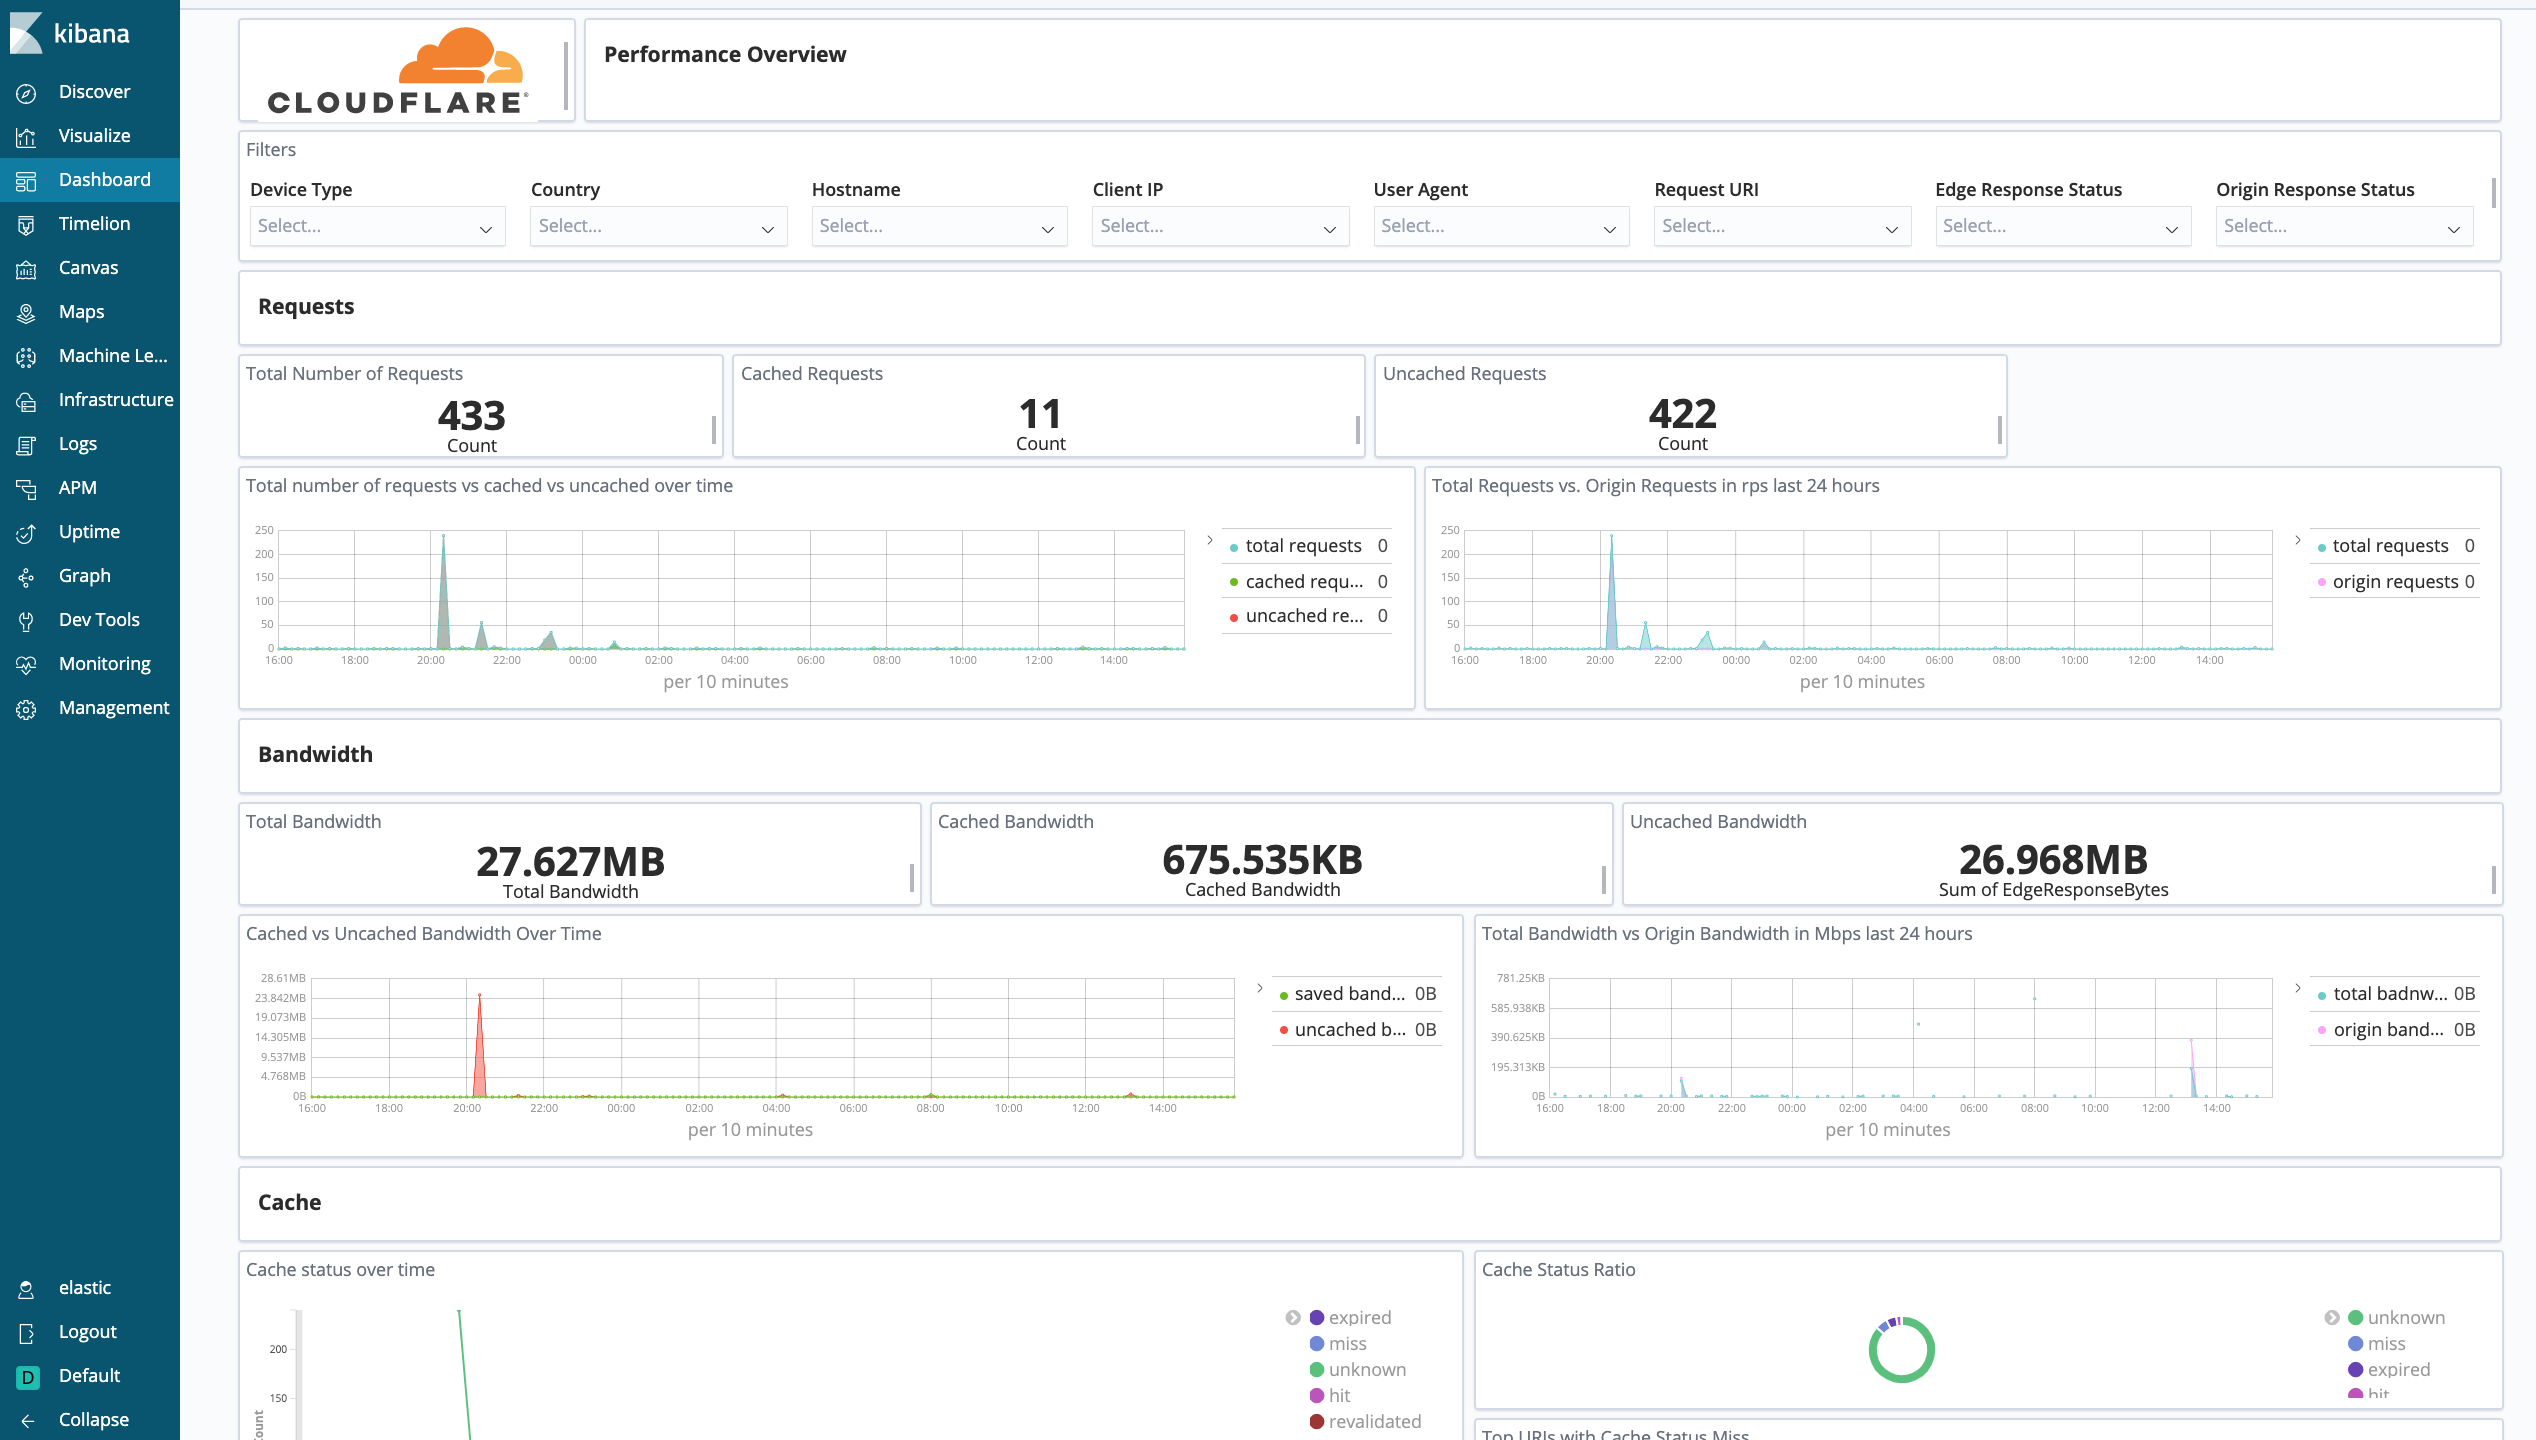
Cloudflare - Performance (Requests, Bandwidth, Cache) - Identify and address performance issues and caching misconfigurations. Metrics include total vs. cached bandwidth, saved bandwidth, total requests, cache ratio, top uncached requests, and more.
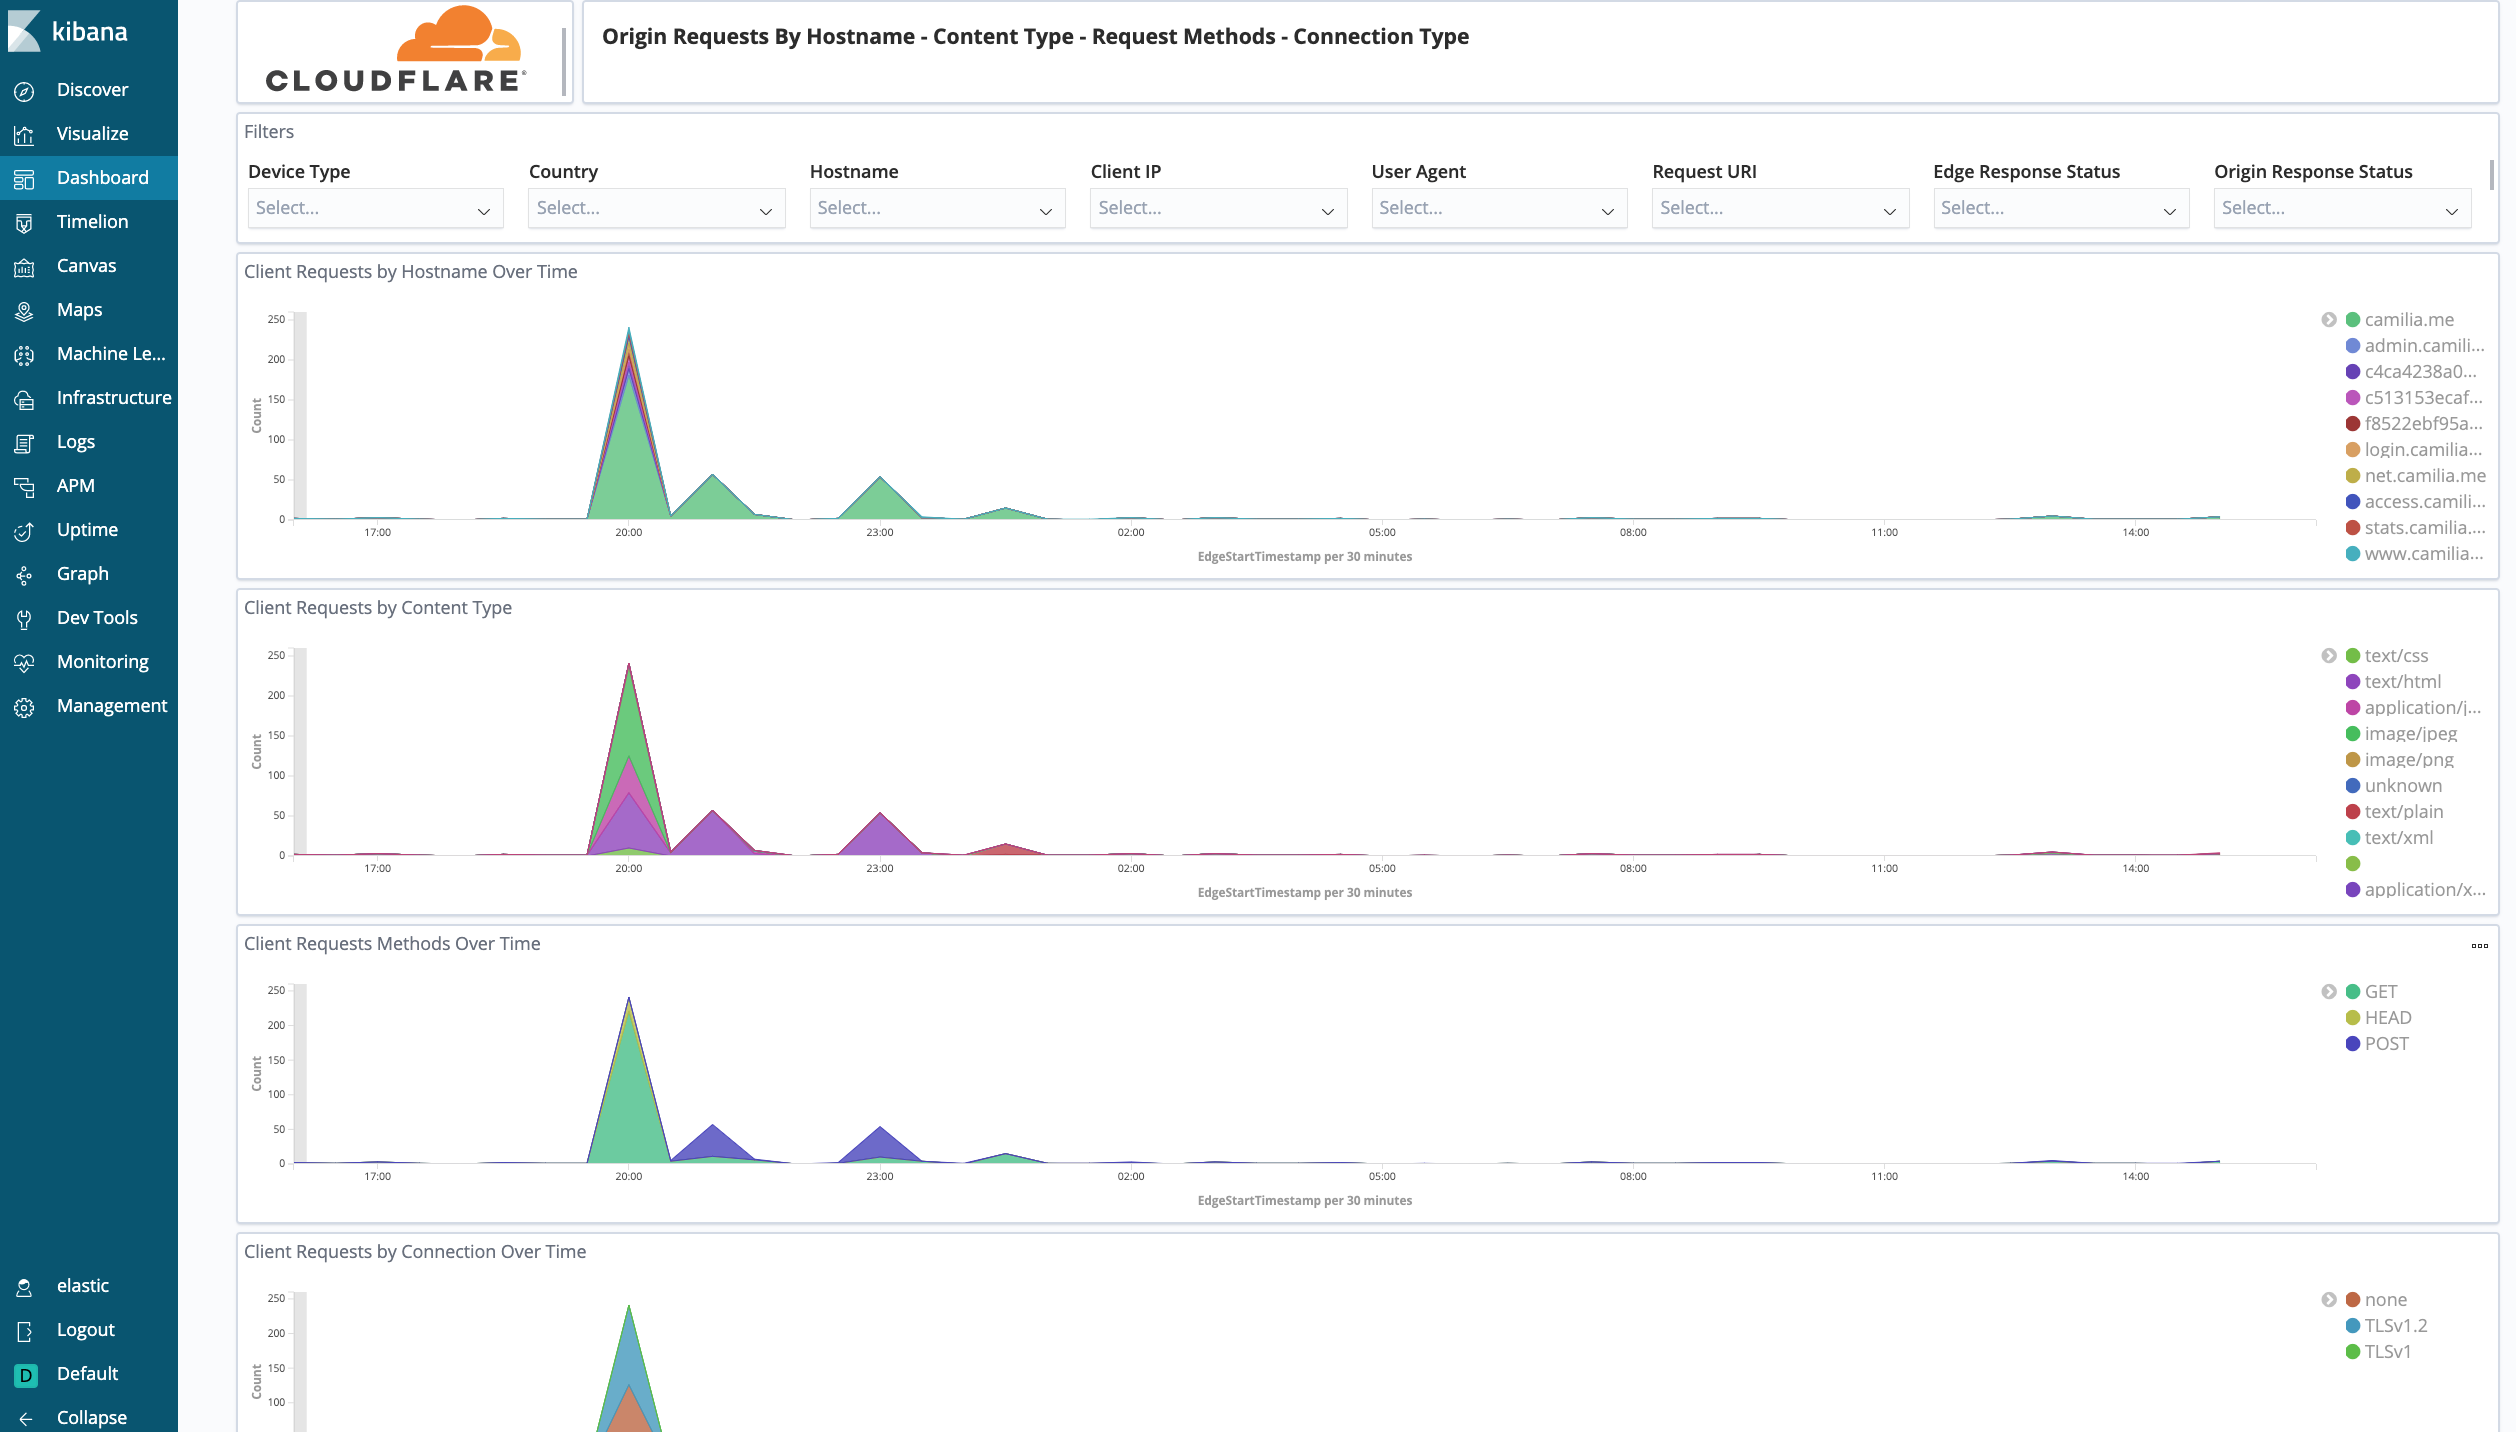
Cloudflare - Performance (Hostname, Content Type, Request Methods, Connection Type) - Get insights into your most popular hostnames, most requested content types, breakdown of request methods, and connection type.
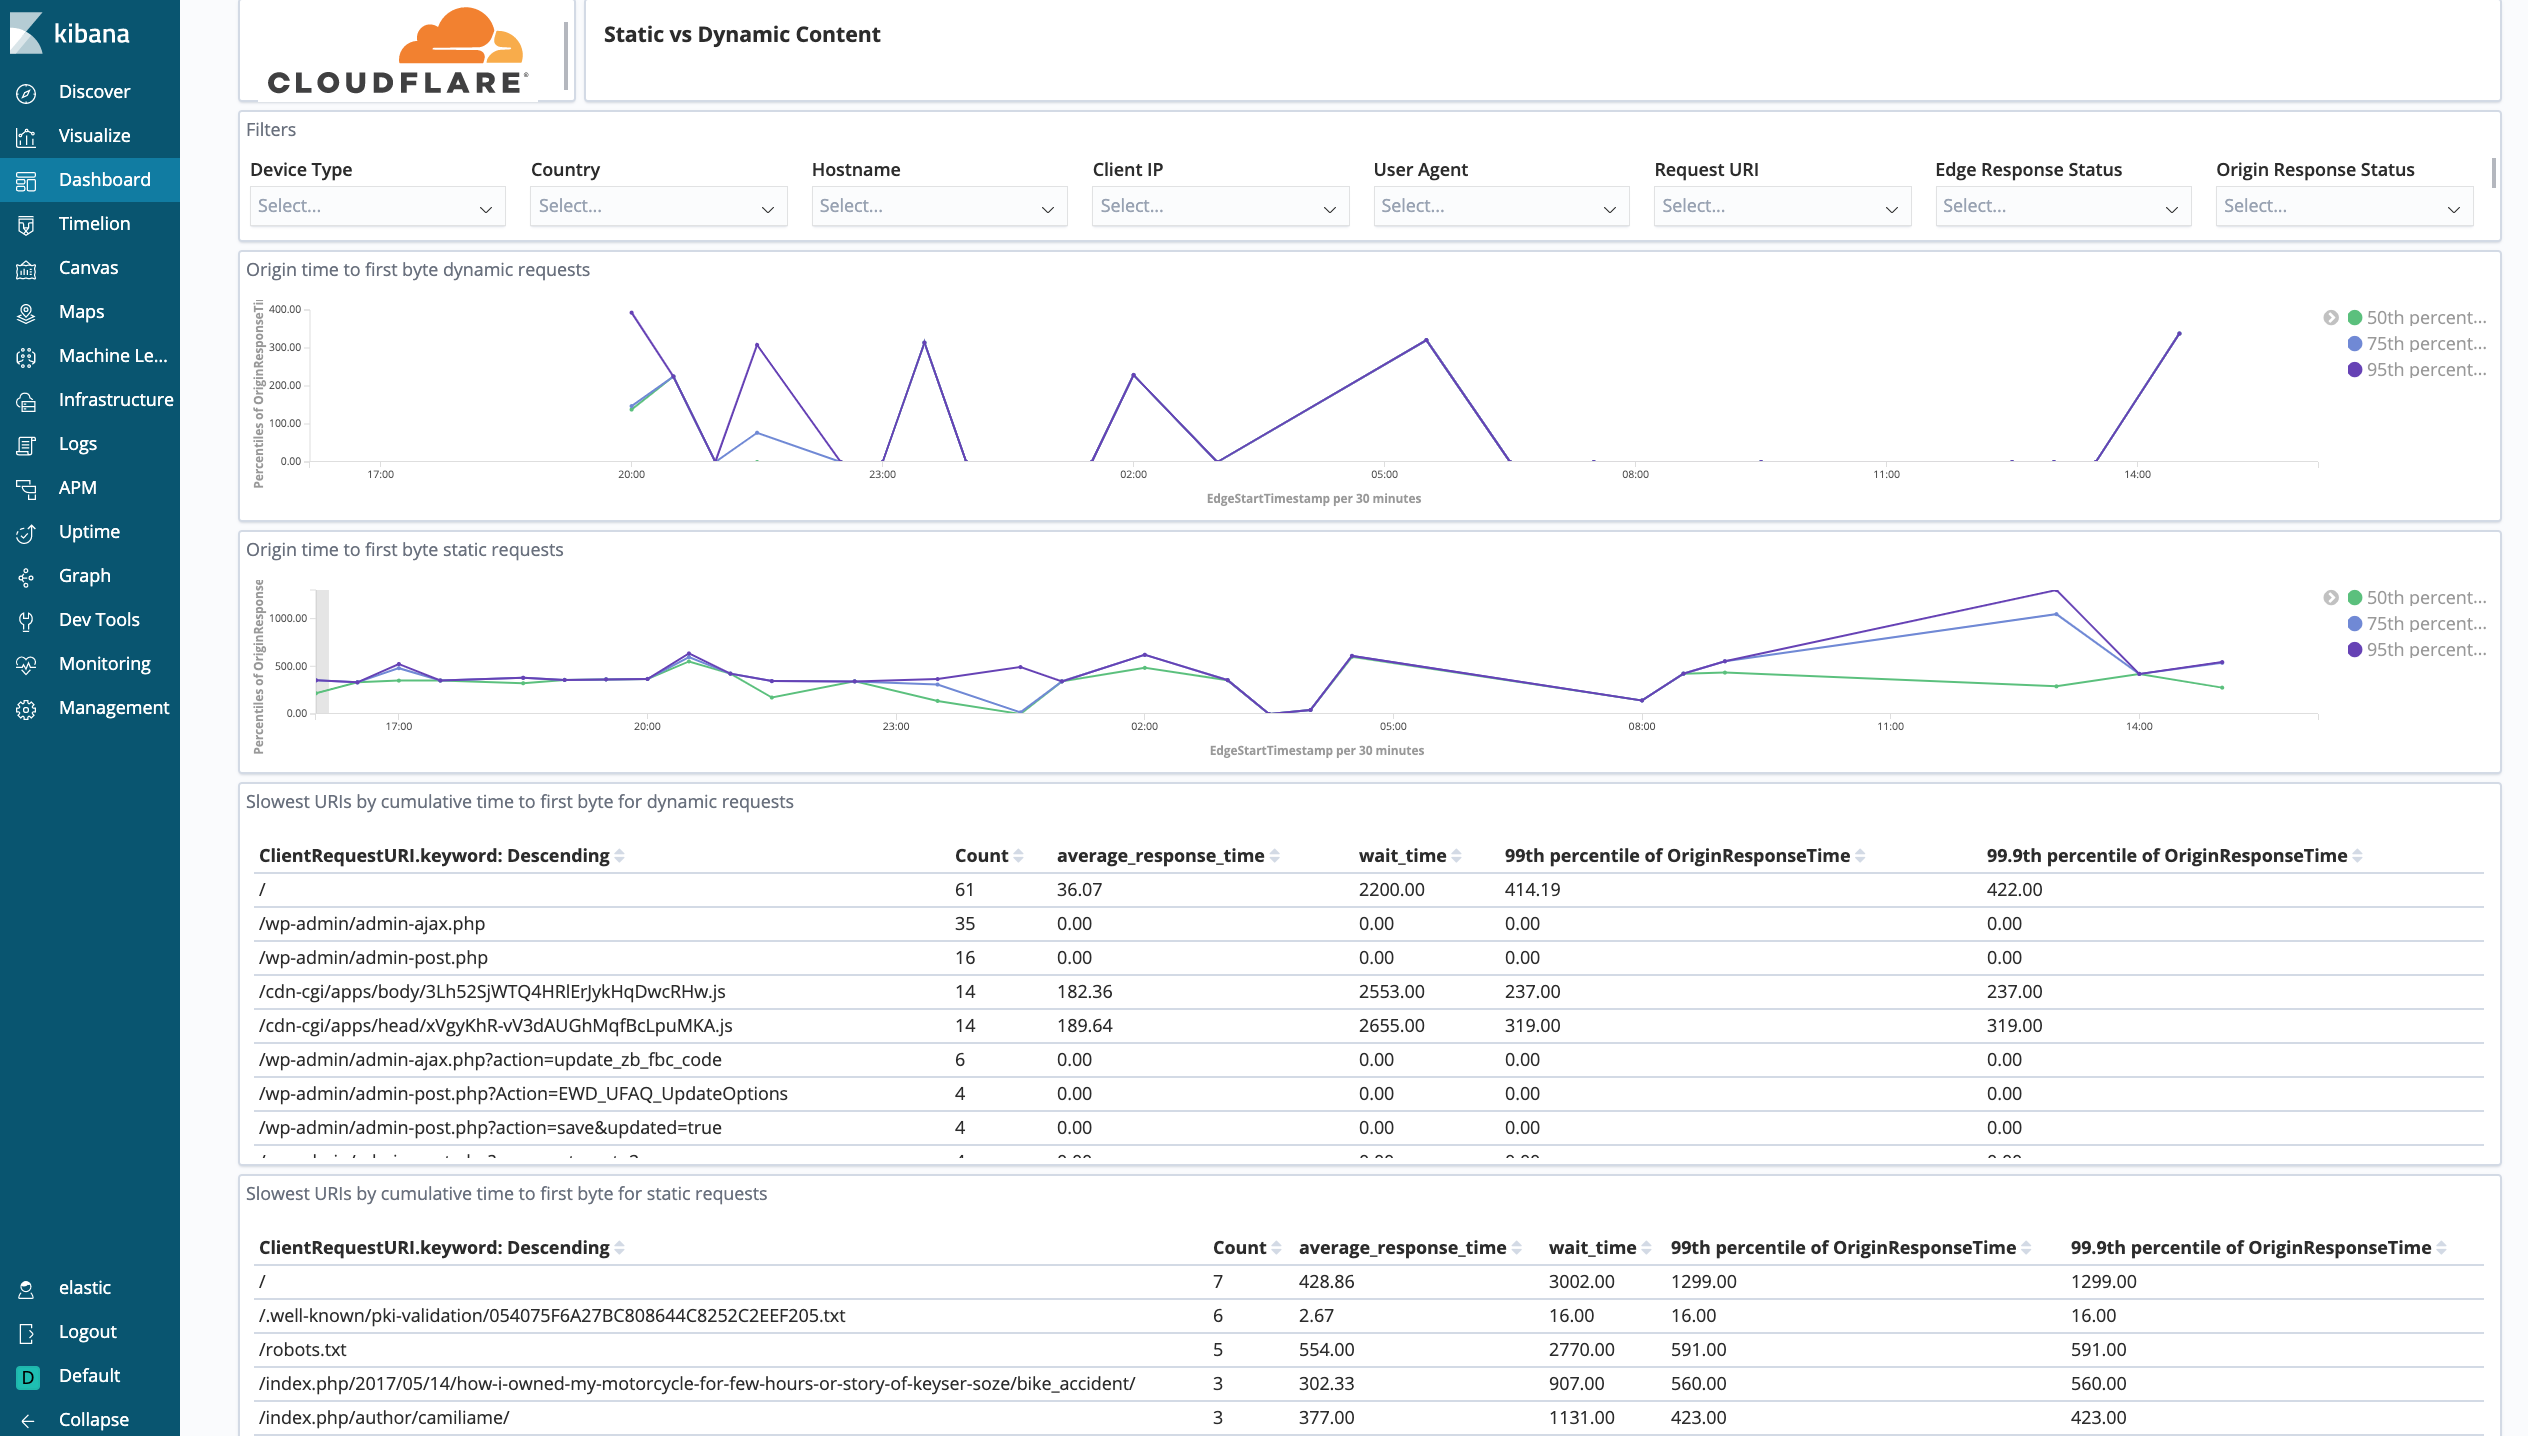
Cloudflare - Performance (Static vs. Dynamic Content) - Get insights into the performance of your static and dynamic content, including slowest URLs.
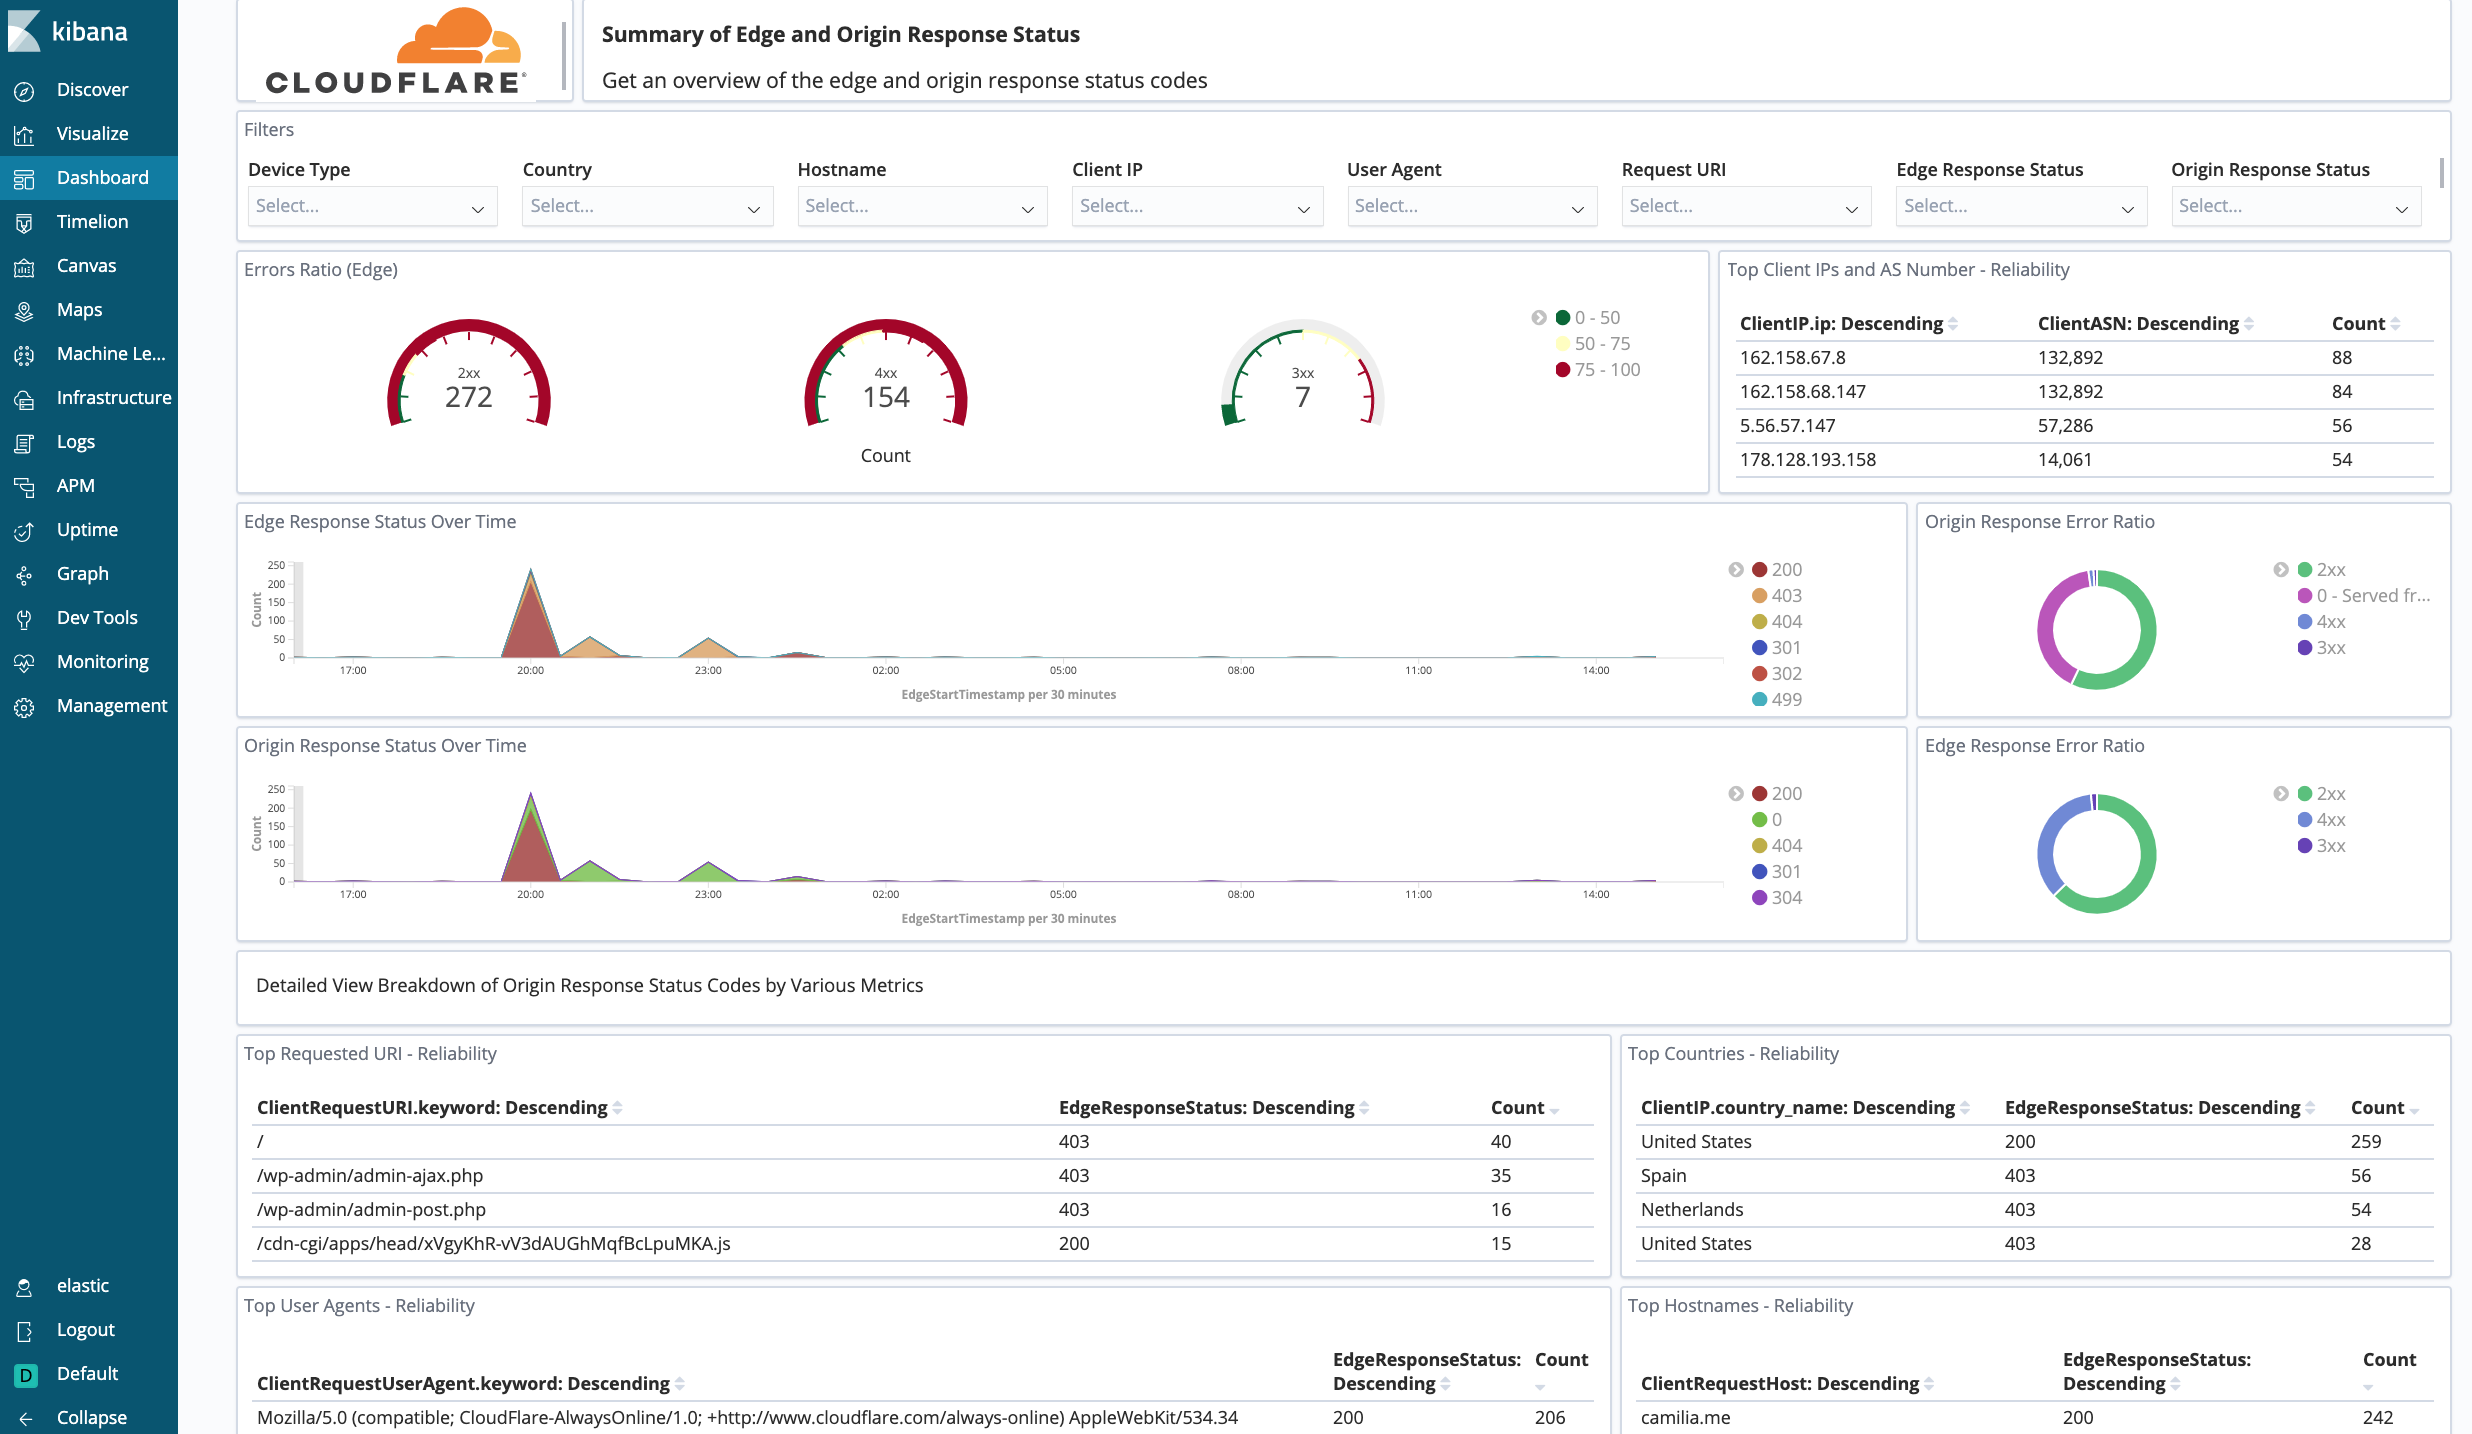
Get insights on the availability of your websites and applications. Metrics include origin response error ratio, origin response status over time, percentage of 3xx/4xx/5xx errors over time, and more.
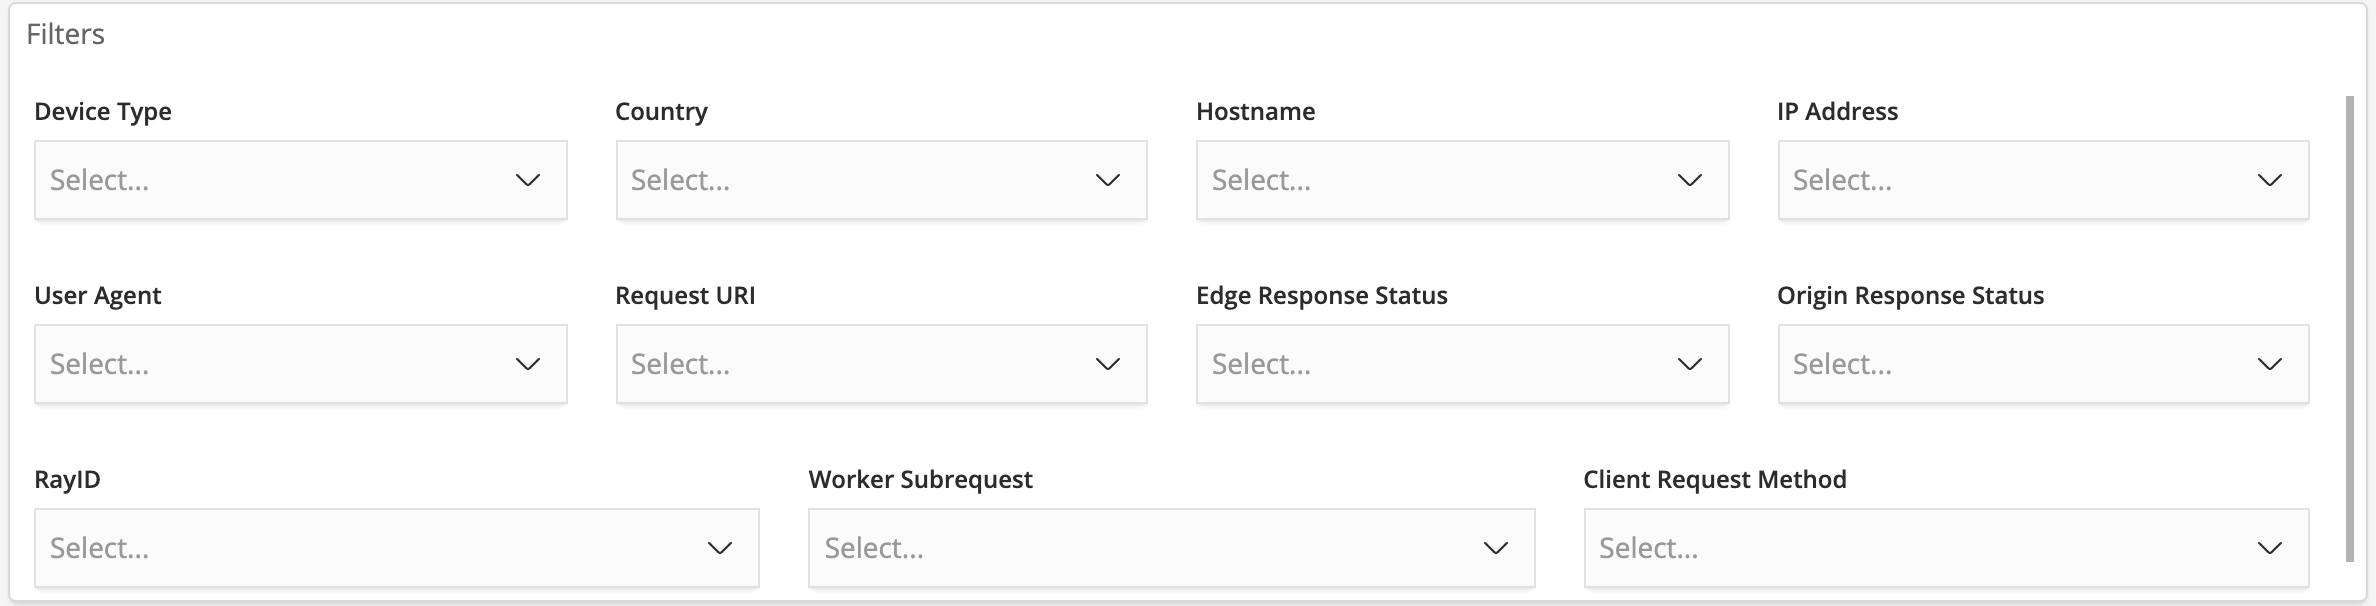
All dashboard have a set of filters that you can apply to the entire dashboard, as shown in the following example. Filters are applied across the entire dashboard.
The default time interval is set to 24 hours. Note that for correct calculations filter will need to exclude Worker subrequests (WorkerSubrequest = false) and purge requests (ClientRequestMethod is not PURGE).
If you detect issues with your AWS Lambda function in Elastic, you can review the AWS CloudWatch logs that are generated automatically for the specific Lambda function.
To begin, in AWS:
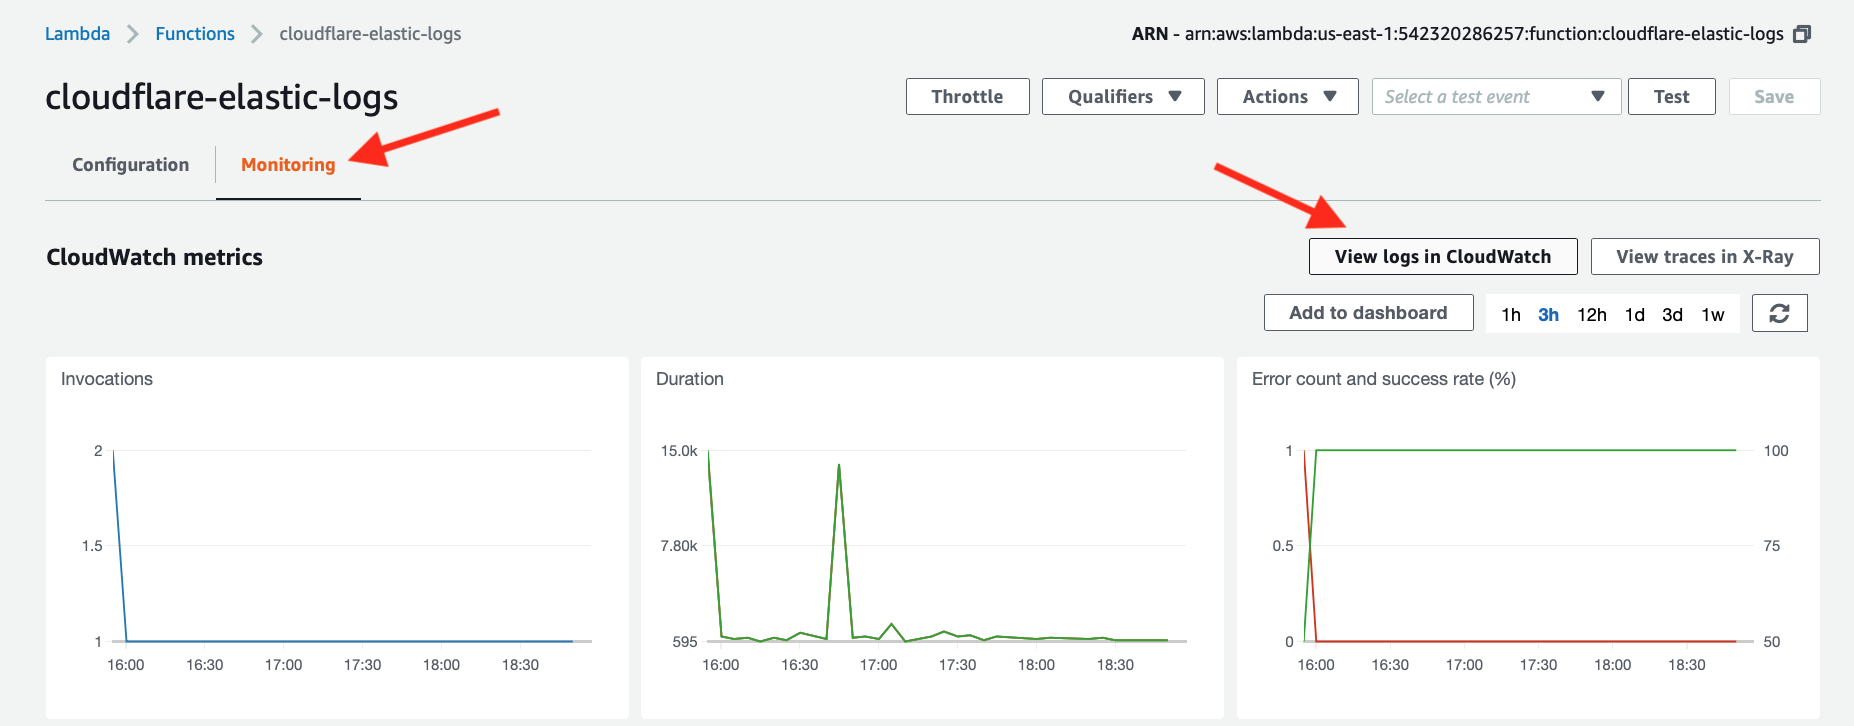
Go to Lambda > Functions > <your Lambda function>.
Click the Monitoring tab.
Click View logs in CloudWatch.
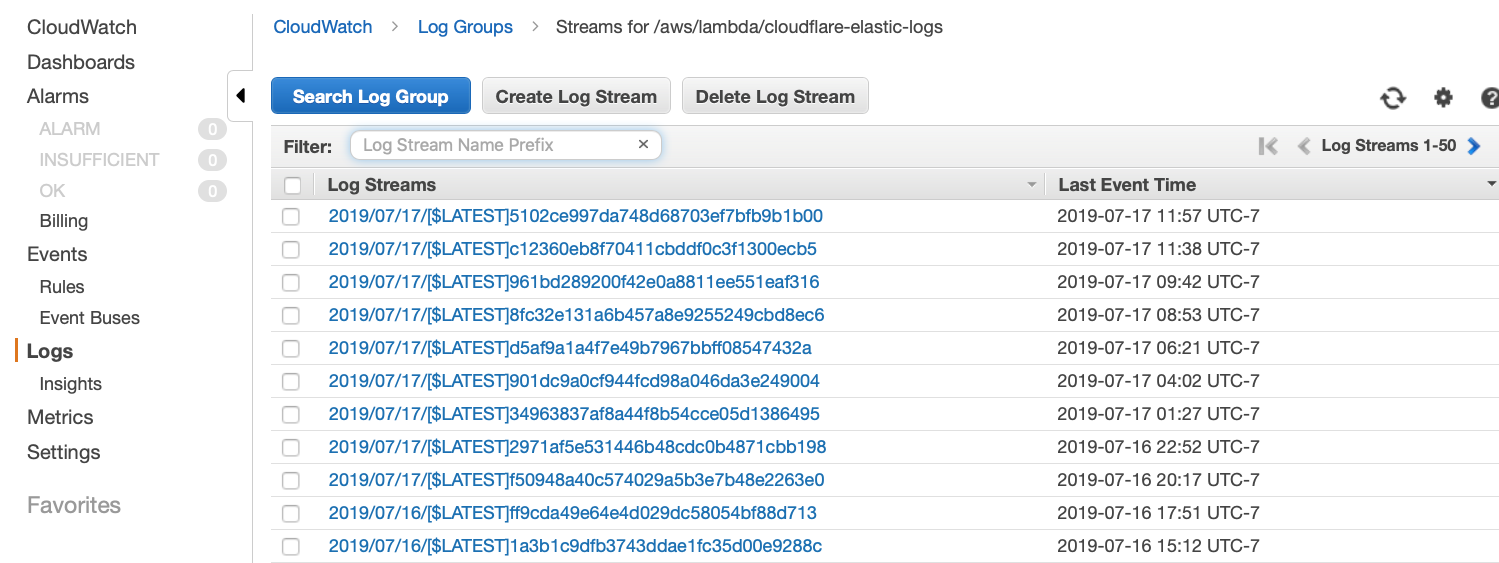
A list of log streams generated by the Lambda function (see image below) appears. Each stream contains log messages. However, some log streams will either be empty or not contain any useful information. You might need to review several of them.
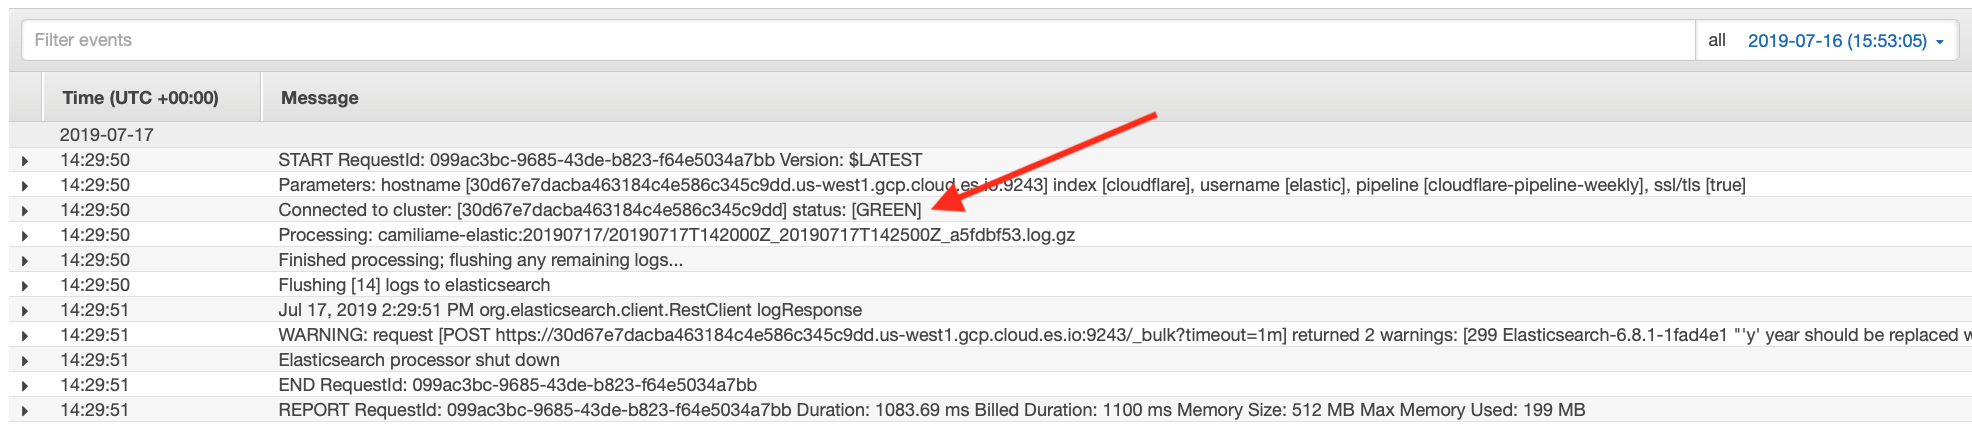
When you click to review a stream, you want to look for messages starting with the text Connected to cluster: and ending with status: [GREEN] as shown in the image below.
If you see status: [RED], then your cluster isn’t healthy and it’s likely that your Cloudflare logs won’t appear. If this is the case, review how to debug in Kibana (see below).
It is important to verify the return status of the call to Elasticsearch. Lines starting with Flushing [N] logs to elasticsearch and followed by a response line indicate that everything is working as expected.
If you run into any other issues, take note of the exact return message and contact your Cloudflare support team.
Review the AWS Lambda function health status from the Kibana console in Elastic Cloud
To analyze the health status of the Lambda function from Kibana:
From Elastic Cloud, launch the Kibana console.
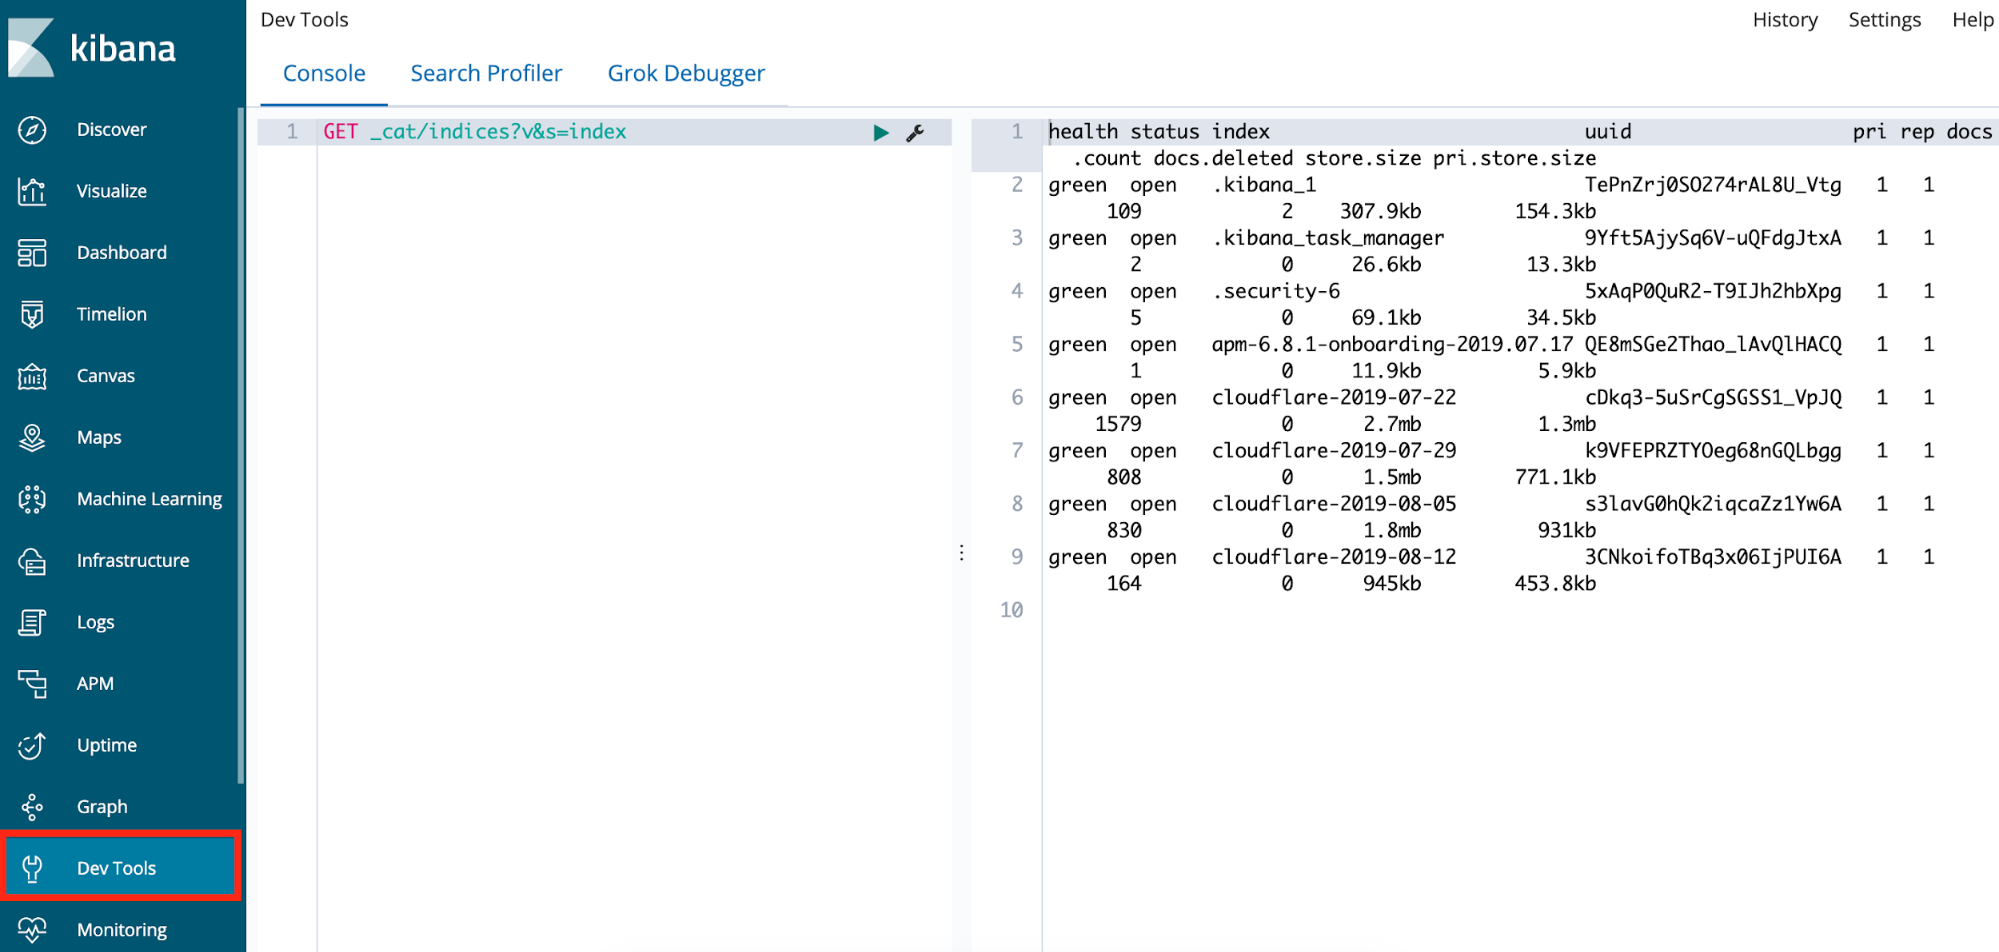
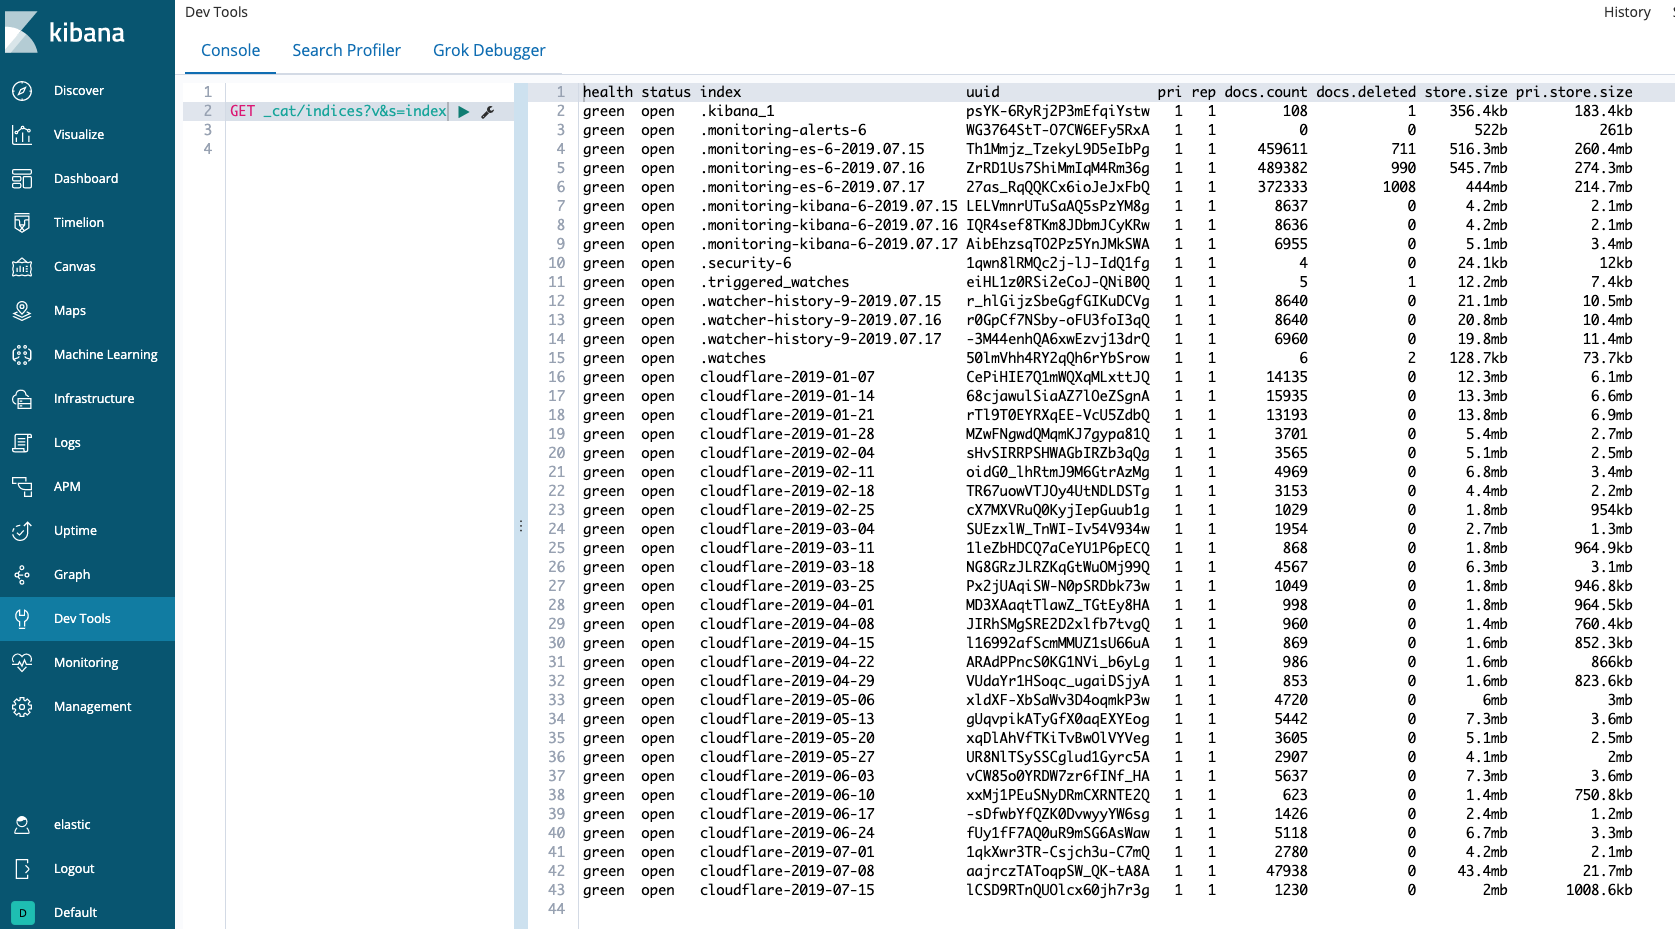
Find the Dev Tools app on the left navigation bar.
Under the Console tab, type the following into the left pane: GET _cat/indices?v&s=index.
In the right pane, you should see a table of indices with the column headings: health status index, uuid, pri, rep, docs.count, docs.deleted, store.size, and pri.store.size.
The first column should read green. If it does not, or if there are no cloudflare-<DATE> indices, then there is a problem loading the logs from the AWS Lambda function.